- Who We Help
- Commodities
- Products
- Pricing
- Pricing Overview
- Spot
- Rack
- Retail
- Price History
- News
- Analytics
- Find a Product
- Pricing
- Energy Transition
- Events
- Resources
- About
- Contact

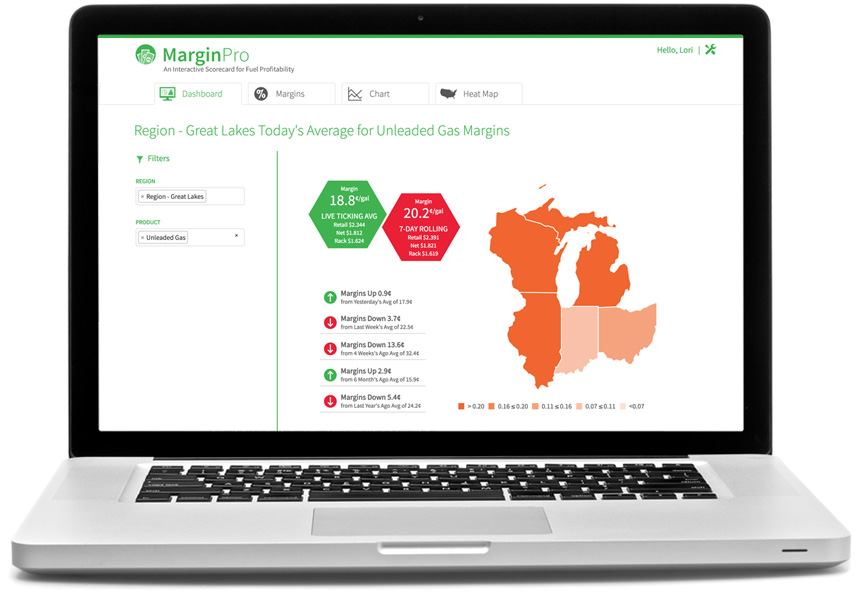
Get an exclusive look at margins over time for competing brands and price leaders with OPIS MarginPro.
This interactive dashboard is your guide for becoming more profitable when selling fuel. Immediately discover if margins are up or down by state, MSA or on a national level with MarginPro’s live ticking average. With its real-time charts and heat maps, find out which regions rank the highest. Create your own fully exportable analysis.

Survey competing retail fuel brand margins so you can price your product more effectively. Identify the most- and least-promising markets for expansion. Find the brands that make the most on every gallon sold.
OPIS DemandPro allows you to tap into local retail station performance data. With accurate and relevant sales trends, volumes and profitability information, you can better compete in your local retail fuel market.
Learn MoreUnderstand retail fuel station performance in each market at the site level. Get next-generation data analytics of trade area, customer demographics, customer loyalty rates, cross-shopping and seasonality. Compile true competitor lists for each station based on shared site visits.
Learn MoreImprove pricing strategy and monitor retail brand power. This interactive web-based tool compares your brand’s volume and price differential against that of your competitors on a local and national level.
Learn More