- Who We Help
- Commodities
- Products
- Pricing
- Pricing Overview
- Spot
- Rack
- Retail
- Price History
- News
- Analytics
- Find a Product
- Pricing
- Energy Transition
- Events
- Resources
- About
- Contact

OPIS complies with all international standards for price reporting agencies set forth by IOSCO, the International Organization of Securities Commissions for spot market pricing.
OPIS Wholesale Rack Pricing
OPIS Premium Benchmarks – Low 2, Low 3 Averages and 2nd Low
OPIS Bottom Line Wholesale Pricing
OPIS Temperature Correction Assessment
OPIS Retail Gasoline Pricing
OPIS Retail Diesel Pricing
OPIS Retail Volumes
OPIS Crude Pricing
OPIS Spot Replacement Index (SRI)
OPIS Biofuels / RIN Credits (version 5.3)
OPIS Carbon Market Pricing (version 12.0)
OPIS NGL Spot Pricing (version 2.0)
OPIS NGL Forwards Pricing
OPIS Residual Fuel Spot Pricing (version 1.3)
OPIS International Feedstocks Pricing (version 2.0)
OPIS Refined Spot Markets:
U.S. Gulf Coast (version 1.7)
U.S. Atlantic Coast (version 2.5)
U.S. Midwest (version 2.2)
U.S. West Coast (version 4.4)
Mexico Fuels (version 1.2)
OPIS Asia Distillates Pricing (version 2.0)
OPIS Asia LPG & Naphtha Spot Pricing (version 1.5)
OPIS Europe Distillates Spot Pricing (version 5.1)
OPIS Europe LPG Spot Pricing (version 5.7)
OPIS Marine Fuels Pricing – Americas (version 1.2)
OPIS Marine Fuels Pricing – Europe (version 2.0)
OPIS Marine Fuels Pricing – Asia-Mideast (version 1.2)
OPIS PetroChemWire Methodology (version 3.0)
OPIS North America Aromatics Daily Pricing
OPIS Europe Aromatics Daily Pricing
OPIS Asia Aromatics Daily Pricing
OPIS APAC Solar Weekly Pricing
OPIS APAC Solar Weekly Modules Forward Curve Pricing
McCloskey Coal, Metals & Mining Markets:
Thermal and Petcoke Methodology
Iron Ore, Ferrous Scrap and Steel Methodology
Coking Coal Methodology
Daily Marker Rationale
Weekly Marker Rationale
OPIS Benchmark Administration:
OPIS Benchmark Administration B.V. Complaints Policy
OPIS Benchmark Administration B.V. Assessment Corrections Policy
OPIS Benchmark Administration B.V. Cessations and Material Changes Policy
Revisions effective 28 February 2022.
OPIS has been a news and price reporting leader in the downstream refined products marketplace since 1977. We have served customers throughout the many industry segments – traders, suppliers, commercial end-users, wholesalers and retailers – with up-to-the minute, news, analysis and pricing that appears in our many published reports and on-line services.
OPIS benchmarks are underpinned by robust methodologies developed in consultation with market stakeholders and are in-line with market realities. Regular reviews by customers and editors ensure the benchmarks are fit for purpose and that there is an open communication channel with stakeholders. This enables the benchmarks to evolve with changing needs and market landscape.
Market data, including trade data, is collected by editors through various channels including telephone calls, e-mails, instant messaging, electronic platforms and electronic transfer of back office deal sheets.
Editors undergo rigorous internal market training and supervision before assessing markets as do “backup” editors who may be called on to fill in for a particular market’s primary editor. Editors’ market calls are internally reviewed daily prior to publication by a supervisory editor who checks their accuracy and adherence to OPIS methodology.
OPIS editors always search for the most complete picture of market activity in their assessments. We believe transaction data should form the bedrock of any price assessment. However, with some products and in some markets the amount of transactional data is much less comprehensive. In such case, OPIS price reporters use bid/ask ranges to set highs and lows in accordance with established methodologies. Highest bid and lowest offer may set the parameters of these ranges. In some cases, historically demonstrated mathematical formulae may be applied to calculate the differential value of an illiquid product relative to a more liquid product.
Stakeholders are encouraged to contribute comments on our methodology year-round to OPIS_Compliance_Team@dowjones.com to help ensure our spot market assessments remain relevant, accurate and comprehensive. Editorial staff will review and respond to all comments. Should comments result in a proposal to amend methodology, a subscriber notice soliciting more specific feedback will be issued.
Stakeholders also contribute to the review of methodologies via responses to our annual request for feedback. This request will be sent via email and noted in the bodies of our reports.
In each of OPIS’ spot methodologies, the timeframe for accepting data submissions for assessment consideration varies from commodity to commodity to reflect the unique nature of each spot market. Detailed timings can be found in respective methodology guides.
OPIS expects/encourages all submitters of spot market data or intelligence to act in good faith by disclosing only truthful and complete data relevant and pertaining to the context of our spot market coverage. OPIS will not accept any data submissions resulting from inter-affiliate transactions and reserves the right to exclude from consideration any data it deems not reflective of fair market value.
OPIS has a complaints policy inline with the IOSCO Oil PRA Principles. This policy describes the procedures and mechanisms for receiving, investigating and retaining records concerning complaints about it price assessments.
In order for a complaint to enter the formal complaints handling process, the complainant must record the complaint in writing, explaining as fully as possible the background to the complaint, and attaching all relevant materials or evidence where appropriate.
The complaint should be sent to:
Email: OPIS_Compliance_Team@dowjones.com
Complaints may be submitted in relation to any aspect of benchmark calculation and management process by employees including:
If an employee of OPIS receives an enquiry from a stakeholder which is not formally stated to be a complaint but could be regarded as such, the employee should make the stakeholder aware of this Complaints Policy.
Upon receipt of a complaint, the Compliance Team will undertake the following steps:
The complainant will be advised of the final outcome of the investigation within 60 calendar days, unless such communication would be contrary to the objectives of public policy. If circumstances warrant a longer time period, the complainant will be informed.
If a complainant is dissatisfied with the way a complaint has been handled or the decision in the situation, the complainant may, within six months, request that the complaint is referred to an independent third party.
All documents relating to a complaint, including those submitted by the complainant, will be retained for at least five years.
On an at least annual basis, the Compliance Team will review all complaints submitted under this policy to determine the existence of any trends.
This Complaints Handling Policy shall be reviewed by the Compliance Team at least annually.
Once OPIS has been made aware of a potential need for a review of the benchmark methodology, it will perform analysis to determine whether such methodology change would be beneficial for the quality and representativeness of the benchmark, and whether it would constitute a material change.
A methodology change is likely to be material if it impacts the index calculation process or formula, the quality of the input data, the index selection rules, the underlying market or reality measured, the panel of Contributors to the benchmark, or the benchmark level. Where a methodology change is beneficial and material, and where it is judged to be appropriate and proportionate, the OPIS Editorial team will start a wider consultation which is addressed to all relevant stakeholders.
As part of a wider consultation on a methodology change to a benchmark, OPIS Editorial will:
When setting such date the OPIS Editorial team will consider the type of benchmark and the extent of its use.
Once a spot methodology change or addition is contemplated, OPIS reaches out to customers in the form of a subscriber notice delivered via email soliciting feedback on the change. Feedback will be given via email or telephone and the opportunity to comment on any contemplated spot methodology change is open for up to four weeks from the notice period.
Situations might arise where the OPIS Editorial Management might consider discontinuing the provision of a Benchmark, for example given a lack of demand for the benchmark, a deterioration in data sufficiency, or changes in market structure. The Editorial team will undertake any benchmark cessation in an orderly manner, taking into consideration the potential impact to users of the benchmark and market integrity. When considering whether to discontinue or terminate a benchmark the OPIS Editorial team will follow the following procedure:
OPIS publishes its market assessment methodology in full on this website and in abbreviated form in its nightly reports. The methodology is written in clear, easy-to-understand language and is fully available to the public and does not require a user name or password for access. Details of each product assessment’s methodology are below.
OPIS’ overarching strategic goal continues to be that it is recognized as a widely accepted fuel price benchmark for supply contracts and competitive positioning. OPIS is relied on as a trusted benchmark because, based on its published methodology and internal policies and practices, OPIS can provide assurance it remains completely unbiased and independent. OPIS has no stake in fuel transactions, is not funded by oil industry initiatives, and strictly adheres to antitrust guidelines determined by independent legal counsel.
OPIS does not discriminate between reporting parties that are in good standing and have demonstrated a commitment and reputation for truthful and accurate price discovery when calculating its market assessments.
OPIS market assessors follow the marketplace throughout a full day of trading by constant communication with designated and approved traders and brokers to discover done deals, bids and offers. This full day methodology requires OPIS market assessors to be in contact with active marketplace participants during every trading day.
The OPIS full day methodology is applied to all of its market assessments with the exception of Europe LPG which utilizes a “market window” to capture deal activity. This window is described fully in the Europe LPG methodology. This “market window” approach to assessing the Europe LPG is a reflection of the preference of the market participants as documented in OPIS’ electronic log of customer feedback and input and reflects the unique nature of the market’s behavior.
OPIS market assessors communicate with market participants via electronic instant messaging (e.g., ICE IM, CME Pivot, AIM), email and telephone communication.
Additionally, OPIS market assessors receive deal sheets from active market participants detailing their market activity for the day.
Only market data that fits OPIS methodology is used in assessing ranges for OPIS spot products. This includes restrictions on the timing of the market activity reports and the volume of product being traded as well as other factors as enumerated extensively by individual commodity, and made publicly available.
Preference for OPIS market assessments is done deals. However, in the absence of done deals, OPIS market assessors use confirmed bids and offers to set ranges for market assessments. Highest bid and lowest offer are used by OPIS market assessors to set ranges in the absence of done deals.
In very illiquid markets, formulations are used to calculate values of derivatives of more liquid products based on historic market behavior. These formulations are set based on market participant feedback and approval.
OPIS supervisors routinely review market assessors’ judgments throughout the trading day and prior to publication of the assessment. Additionally, OPIS supervisors review any market data not used in the assessment and the reasons they were not used.
Units of measure referenced in OPIS market assessments vary depending on the standard measurements used by the commodity marketplace being followed (e.g., refined products are assessed in US dollars per barrel while renewable biofuels such as ethanol are assessed in US dollars per gallon).
Each market OPIS assesses has three fully trained market editors assigned to it. Each of these market editors is fully versed in the latest methodology, market participants and market intelligence available for that market. In the event the primary market editor is not available to assess his or her market, the secondary editor is fully capable of stepping in to assess the market. Additionally, a third level of redundancy in editorial continuity is built in. All OPIS data is thoroughly archived and backed up by information technology systems and hardware on- and off-site.
New OPIS market assessors undergo apprenticeship training in OPIS methodology and are required to observe closely as veteran market assessors assess markets for a period of no less than four (4) weeks prior to assessing those markets themselves.
Additionally, OPIS market assessors report to and are supervised by a core group of veteran OPIS senior editors who ensure OPIS methodology and defined practices and procedures for assessing markets are consistently followed.
OPIS market editors give all due priority to concluded transactions when making market assessments with the exception of market trading days in which an exceptional event or anomaly occurs just prior to OPIS’ deadline for publishing market assessments. However, all price assessments that deviate from OPIS’ prioritization policy for transactional data require the consultation and prior approval of a supervisory editor.
In the case of illiquid markets where transaction volume is light or non-existent, editors draw upon bids and offers and other market intelligence to set ranges. In some cases, assessments are made based on historically demonstrable formulaic relationships to more liquid products that are reviewed regularly with the marketplace to maintain their relevance.
In the absence of done deals, OPIS market assessors can set ranges for products in somewhat illiquid markets based on bids and offers heard in the marketplace. In such cases, OPIS market assessors use a highest bid/lowest offer methodology.
Some OPIS market assessments are “notional values” meaning the product markets being assessed do not typically feature daily activity such as done deals, bids or offers. Instead, these markets are understood by the marketplace, OPIS customers and OPIS market assessors as formulations referring back to a “parent”, more liquid product based on historical and logical pricing relationships affected by known transportation, storage or handling costs.
OPIS market assessors track spot markets on a full-day basis and OPIS’ daily ranges reflect confirmed trades by timing, volume, product and location each day.
“Typical” trading hours extend from 9:00 a.m. to 5:15 p.m. Eastern Time (6:00 a.m. to 2:15 p.m. Pacific Time), with the exception of the U.S. Atlantic Coast, where trading hours extend from 8:00 a.m. to 5:15 p.m. Eastern Time). Deals that are received outside those hours are reviewed, evaluated and independently approved for consideration in our full-day ranges. In order to meet publication deadlines, OPIS reserves the right to not accept deals as part of the final day’s product ranges if that information is sent to/received by OPIS after 5:15 p.m. (2:15 p.m. Pacific Time).
OPIS market assessors sample on a daily basis a broad cross-section of refiners, traders, marketers, brokers and end users active in buying, selling or trading physical barrels. OPIS policies and practices require market assessors to cast a wide net to capture as many transactions as possible in arriving at OPIS day-to-day price assessments of spot market values. OPIS market assessors take an “arm’s length” approach to covering the market.
OPIS daily spot market assessments include information obtained from “back office deal logs” sent to OPIS as part of its daily market price discovery. The information highlights actual transactions during the day, including price, volume, product, timing and counter party. OPIS market assessors compare the end-of-the-day deal logs with our confirmed deals through the day to ensure OPIS does not duplicate information. OPIS confirms deals via constant communication with traders and brokers in the marketplace.
OPIS takes into account in its daily full-day price assessments market data from a variety of approved reporting entities. The volume of data coming from any single entity on any given day can vary, depending on that entities activity (buying or selling needs) in the marketplace.
OPIS gives equal weight to all market data submitted and deals confirmed based on our published methodology. To ensure consistency and integrity, all deals are weighed equally, without respect to any single data provider constituting a significant proportion of the total data.
OPIS requires its market assessors to conduct a broad canvass of the market each day so that OPIS is not “submitter dependent” on any one source for any single portion of data.
Market liquidity varies by individual regions from day to day with pipeline scheduling days typically reflecting high volume days.
OPIS adheres to its methodology language first and foremost. Any data that does not conform to the methodology’s definitions regarding timing, size, specification, volume or verifiability are not included in OPIS’s market assessments.
All data exclusions must be reviewed and approved by an OPIS supervisory editor.
Additionally, OPIS market assessors reserve the right to exclude market data received that either: 1) cannot be repeated in the marketplace, 2) cannot be confirmed in the marketplace by counter-parties or independent market observers and/or 3) comes from a source that is unidentifiable and/or unverifiable as a “bona fide” source of market data.
All OPIS market assessments follow methodologies reflective of the market’s actual behavior with regard to timing of trading, specifications of product, location of trading, and historically established relationships between products.
OPIS methodologies are carefully crafted through market participant consensus and are designed to be inclusive of all market data that fits OPIS published methodology parameters, including restrictions for inclusion of any market data that does not fit those same parameters.
The timeframes in which products are assessed are those requested by the market participants and vary from product to product.
OPIS market assessments commonly use the terms “prompt” and “any” to describe the timing of product delivery. Definition of timeframes for these terms varies from market to market and from product to product. In general, however, “prompt” refers to product expected to make delivery within a week while “any” refers to product expected to make delivery after a week’s time but before the end of a month.
For over 30 years clients have trusted OPIS to adhere to strict anti-trust guidelines in collecting and distributing sensitive oil pricing data. With oil prices under increasing scrutiny, OPIS recognizes that suppliers cannot afford even the slightest perception of price sharing or price signaling. That’s why OPIS does not provide price notification and messaging services for suppliers and embargoes release of all rack pricing data until after the changes become effective to customers.
Price Discovery
Every day, including Saturdays, OPIS updates its wholesale terminal prices from hundreds of sources. Some suppliers confirm prices directly using the same pricing messages their customers receive. For many other suppliers, prices are collected from their customers who OPIS deems are reliable sources.
Data Integrity
Verification of prices is done using documents provided by either the supplier or customers. Multiple sources are required for prices received via customer channels. In order for a supplier’s price to be added to OPIS rack coverage, their price and the consistent supply of barrels at that location must be verified with multiple customers. It must also be a wholesale terminal rack price and not a commercial or consumer end-user price; this avoids mixing classes of trade and misrepresenting true wholesale postings and averages.
OPIS uses several levels of automation to make sure prices that have not changed at usual intervals are fresh. If a price has not changed in 48 hours, it is electronically flagged and a pricing specialist is alerted so as to track down whether the number still represents an active and meaningful listing. OPIS specialists pinpoint prices that are outside specified reasonable parameters to avoid displaying inactive prices where product may not be available or where special circumstances may dictate that the number is not representative of where most wholesale commerce is taking place. Products tagged as “out-of-product” or “out-of-average” will not be part of the OPIS lows, highs or averages. When an entire terminal is shut down due to weather or other catastrophic events, supplier prices are left intact, until suppliers stop sending prices for the terminal.
California Cap-at-the-Rack (CAR)
Go here for details on California’s Cap-and-Trade program and learn how OPIS will handle these regulations.
Time Stamp (all times are ET)
OPIS Newsletter Benchmark Pricing and 5-day Averages
This “Original OPIS Rack Benchmark” started in 1980 when the market moved only once a week. Since major fuel purchases are still referenced to this published price, it is one of many benchmarks available from OPIS today. OPIS Newsletter pricing is frozen each Thursday evening (except on holidays) and is based on that day’s closing gross average of all supplier postings in each OPIS Rack market. Each OPIS Newsletter Rack Benchmark report also contains the OPIS 5-Day Average Benchmark which is the rack average of the gross closing prices from the prior Friday, Monday, Tuesday, Wednesday, and Thursday (except on certain holiday weeks). If a holiday falls on a Thursday, like Thanksgiving, the Newsletter Rack Benchmark is frozen on Wednesday at close and the 5-Day Average Benchmark becomes a 4-Day average from the previous Friday, Monday, Tuesday, and Wednesday.
New products or assessments (used to normalize rack prices) added on a day other than a Friday will use only the days where OPIS has a value to create the 5-day average for the price or the normalized price (based on the assessment).
OPIS Newsletter Rack Benchmark pricing is available as full PADD reports in the OPIS Newsletter which is delivered every Monday. OPIS Newsletter Rack Benchmark pricing is also delivered immediately after the prices are frozen on an individual rack basis.
Rack Formats
Rack Pricing History
In addition to providing daily, up-to-the-minute wholesale rack prices, OPIS maintains the largest and most extensive wholesale terminal price historical database of any company in the world. OPIS’s historical rack prices date back to 1981, when oil prices were decontrolled. Prices are available on a daily, weekly or monthly basis by market, by company, and by product.
RVP
OPIS shows 9.0 RVP as the indicator on all conventional and blended products when Low RVP is not required. 9.0 RVP will be the indicator used for all RVP that is 9.0 lbs or higher.
The OPIS Low 2 and Low 3 Premium Benchmark averages are calculated by averaging the lowest two (or lowest three, for the low 3 average) supplier prices per rack city, product, grade, RVP (if applicable) and octane (if it is an OPIS octane specific rack report).
The OPIS 2nd Low Premium Benchmark represents the second lowest price per rack city, product, grade and RVP (if applicable) and octane (if it is an OPIS octane specific rack report). In the event that two suppliers have the same price, the 2nd Low Premium Benchmark may be the same value as the OPIS Low Benchmark.
The OPIS Premium Benchmarks are available for Contract, Closing and Calendar Day benchmarks. All OPIS Premium Benchmarks are tailored for standard, terminal, gross and/or net rack reports.
Requirements for OPIS Premium Benchmark Inclusion
Definitions of Inclusion for Standard and Terminal Rack Reports
Price Discovery
Each day OPIS uncovers wholesale fuel purchases transacted at values below the lowest rack price that appears in the OPIS daily wholesale rack display. We verify these transactions and publish these discovered ‘Bottom Line’ values by market and product to give buyers and sellers visibility into the lowest transacted wholesale purchase prices on any given day.
Please Note: When Spot markets are closed the Bottom Line Report will not be published.
Bottom Line prices are contrasted against the OPIS benchmark low posted price to identify how much lower these Bottom Line prices are. Only markets where Bottom Line wholesale values below the OPIS benchmark low will appear. Bottom Line prices include TVAs and other discounts and are often contract prices between suppliers and purchasers reflecting volume discounts, although specific volumes are not reported.
Data Integrity
Bottom Line values are always net and contrasted against the net OPIS Contract/Closing Terminal low poster. The delta from the OPIS low is posted. The supplier of the Bottom Line value will not be identified and all Bottom Line values are rounded.
Time Stamp
Published twice daily:
The OPIS Temperature Correction Assessment is based on previous day’s ambient weather and pricing data.
Price Discovery
Every day OPIS captures nearly 5 million retail gasoline and diesel prices for up to 150,000 unique fuel stations throughout North America. Through relationships with fleet card companies, direct feeds from leading retailers, and crowdsourced data from popular mobile applications, OPIS is able to provide the most comprehensive and accurate pump prices in the industry.
The OPIS retail data is relied on by many of the top fuel retailers in the country to replace store manager surveys. Additionally, many websites and mobile applications source fuel prices from OPIS, and most of the largest automobile manufacturers display our real-time fuel prices in their connected car onboard platforms.
Data Integrity
To ensure accuracy of the retail prices and station information, OPIS scrubs the incoming data from our suppliers using many quality control processes. Automated queries such as station brand changes, product mapping, and price flipping among many others alert our team of more than a dozen data quality analysts of changes in real time, who validate and update station and pricing information to ensure the highest standard of accuracy.
Through close relationships with fuel-industry customers, OPIS is alerted of potential discrepancies in our data set, which further enhances our ability to manage and correct pricing issues. Additionally, OPIS has begun to utilize data science and machine learning techniques to help identify and eliminate problematic data.
Standard Levels of Coverage (U.S. Data for Regular Unleaded Gasoline)
Within Last 24-Hour Period: at least 1 price at 87% of all stations
Within Last 48-Hour Period: at least 1 price at 96% of all stations
Within Last 72-Hour Period: at least 1 price at 98% of all stations
Price Discovery
OPIS surveys the current retail prices of No. 2 low sulfur and Ultra Low Sulfur diesel fuel from more than 8,000 active truckstops and travel plazas in the U.S. and Canada. Retail prices are gathered by major fuel card companies including Comdata and EFS as well as through direct feeds from major truckstop chains.
OPIS reports wholesale fuel prices by products as defined by EPA standards more so than by any type of product use. For example, the EPA defines low-sulfur fuels as having a sulfur content of less than 500ppm and Ultra Low Sulfur diesel as less than 15 ppm.
Data Integrity
OPIS marries this retail price data with current rack and tax rate information to calculate the estimated laid-in costs and profit margins of fuel at each of the fueling sites included in the OPIS survey. The OPIS estimated cost figures are recognized as the industry standard for benchmarking “Cost Plus” fuel purchases by large trucking fleets.
Cost Plus is a method of purchasing fuel at the retail level where the fleet (buyer) and truckstop (seller) agree to a fixed margin above the cost of the fuel to the truckstop. This fixed margin protects both the fleet and the truckstop by ensuring the cost of fuel to the fleet and the profit to the truckstop is tied to a legitimate market index.
The following is a list of the diesel fuel products OPIS tracks and some typical uses for those products.
No. 2 Ultra Low-Sulfur
No. 2 Ultra Low Sulfur has a sulfur content of less than 15 ppm and must be used to supply at least 80% of the nations on road diesel fuel sold at the retail level as of October 15, 2006. In addition to clear No. 2 low sulfur, OPIS also provides pricing for Red Dye, Premium, Low Emissions and Winter grades of Ultra low-sulfur diesel fuels. All of the OPIS Ultra Low-Sulfur diesel products are understood to include lubricity.
No. 2 Low-Sulfur
Clear low-sulfur (LS No.2) diesel has a sulfur content up to 500 ppm and can be used for up to 20% of the nations on road diesel fuel sold at the retail level. In addition to clear No. 2 low sulfur, OPIS also provides pricing for Red Dye, Premium, Winter, Low Emissions Diesel and Lubricity grades of low-sulfur diesel fuels.
No. 2 High-Sulfur
Clear high-sulfur No.2 diesel is used as an off-road fuel for equipment such as farm machinery or as home heating oil.
No. 1 Low-Sulfur
Clear low-sulfur fuel is commonly used for “blending” on-road fuels. Diesel is blended during winter months to create a diesel fuel that will not solidify or gel in colder temperatures.
No. 1 High-Sulfur
Clear high sulfur is used for various off road agricultural and industrial purposes. Crop drying ovens is one example.
Kerosene
Kerosene has a lower freeze point, lower flash point and lower pour point.
Red-dye
Diesel fuel is dyed red to denote it is being used for tax-exempt purposes. Entities that are tax-exempt (school boards, etc.) use red-dyed fuel because it is tax exempt. There is no difference in red-dyed product specifications. Red-dyed prices typically are 0.25 to 0.35cts higher than clear prices to recoup the charge for the dye and dying process.
Premium Diesel
The higher cetane rating is what makes a regular diesel a premium diesel, along with some type of detergent package that serves to clean the engine as the fuel is burned. Cetane is to diesel what octane is to gasoline. Premium diesel typically has a minimum 45 cetane rating, whereas regular diesel is closer to a 38 to 40 cetane rating.
Winter Diesel
During the winter months, on road diesel fuels may be blended with other diesel fuels or chemical additives to produce a Winter diesel that will not begin to solidify or gel due to cold temperatures. OPIS also provides pricing for Red Dye, Premium, and Lubricity grades of Winter diesel fuels.
Lubricity
Several states have mandated the use of a lubricity additive in several on road Low Sulfur diesel fuels. OPIS provides separate pricing displays for Low Sulfur and Low Sulfur with lubricity products. Diesel postings which may include lubricity are Low Sulfur, Red Dye, Winter and Premium diesel products. Since all Ultra Low Sulfur products must have a lubricity component, it is not necessary to maintain a separate lubricity product grouping within Ultra Low Sulfur products.
CARB Diesel
As of June 1, 2006, all diesel fuel sold for vehicular use in California must meet a 15 ppm maximum sulfur limit (Ultra Low), in addition to meeting all of the current low aromatics CARB diesel specifications. The definition of “vehicular use” in California includes on-highway vehicles and non-road vehicles such as agriculture and construction equipment.
Low Emissions Diesel
Beginning in October 2005, 110 counties East/Central Texas required the use of Low Emissions Diesel or LED in both on-road vehicles and in non-road agricultural and construction equipment. LED diesel must contain less than 10 percent by volume of aromatic hydrocarbons and must have a cetane number of 48 or greater.
NRLM Diesel
Effective June 1, 2007 for refiners and October 1, 2007 for marketers, U.S. supply points required lower sulfur diesel for off-road transportation use in locomotives and for marine use in boats, etc. in various states.
This new fuel,called NRLM diesel for Non-Road Locomotive Marine, contains more than 15 ppm sulfur but less than 500 ppm sulfur and replaced the high-sulfur diesel fuel that exceeds 500 ppm and is still used for home-heating oil purposes.
Where it exists, OPIS racks display NRLM diesel simply as “NRLM.”
By 2010, all off-road locomotive and marine transportation fuel must meet NRLM specs.
Time Stamp (all times are ET)
The Retail Diesel prices and the OPIS Gross Contract Average are used to create these numbers. The data is delivered Monday through Friday by email, the Internet, FTP and many third-party vendors.
About Retail Volumes (OPIS Demand/DemandPro):
Data Collection and Aggregation:
Report Publish:
Report Content:
Price Discovery
Many of the daily prices we report provide key benchmarks for some of the largest buyers and sellers of NGLs in the world. Large utilities, petrochemical companies, industrial and manufacturing companies, rail companies, fleets, natural gas producers, gas processing companies, refiners, pipeline companies, and state and local governments buy and sell NGLs based on OPIS spot market assessments.
For North American markets, editors confirm and record deals done for NGLs between 9am and 4pm Eastern time (8am-3pm Central time) on a fixed price basis or in a relationship to another product or location or timing (example: E-P mix at a differential to purity ethane, TET propane at a differential to non-TET propane, prompt a penny over any current month). Transaction data is due to OPIS no later than 4:15 pm ET.
OPIS tracks any current month, prompt, and out month trading for NGLs. OPIS NGL prices labeled as “any current month” represent transactions for product that buyer and seller agree will be delivered at any time during the current calendar month. OPIS NGL prices labeled as “prompt current month” represent transactions for product that buyer and seller agree will be delivered within the next 48 hours. OPIS NGL prices labeled as “out month” represent transactions for product that buyer and seller agree will be delivered any time in the next calendar month.
Data Integrity
Because of the subjectivity of publishing NGL spot ranges, editors talk to a very broad cross section of participants including domestic and international producers, end users, refiners, processors, traders, brokers, shippers, wholesalers, and retailers.
Ranges represent where the bulk of product is moving and do not include deals struck under extraordinary circumstances and far outside the range of other deals reported on a given day, or far above or below confirmed seller or buyer levels, or under certain volumes, generally 10,000 bbl at Mont Belvieu and 5,000 bbl in the Conway markets, though deals done in these volumes are not automatically included by virtue of the volume, and deals done in smaller volumes may at times be included at the discretion of the editor. Ranges reflect actual transacted deals, but in the case of confirmed trading followed by a shift in the market without a done deal, editors will consider subsequent confirmed and legitimate bid-asks in determining the overall range, taking into account the input of the trading community, material shifts in the market at large, and the relationship the illiquid product may have with more actively-traded products.
For Hattiesburg Spot Gas Liquids Prices, prices for a volume of 5,000 barrel (bbl) will be the minimum considered for use both for in-line and storage propane price ranges. The 5,000-bbl volume reflects the most commonly reported trade done for this market. Deals done at those volumes are not automatically included by virtue of the volume. Price ranges will reflect either fixed-price trades, buy/sell trades or spreads to Mont Belvieu markets. Unless a specific spread or buy/sell value is reported, editors will have discretion with regard to assessing the timing and relation between Hattiesburg fixed-price trades and Mont Belvieu prices. In the absence of reported trades, editors will assess Hattiesburg prices based on the most recent spread assessments to Mont Belvieu propane markets.
Minimum volumes are not necessarily a consideration for Louisiana, Canada and West Coast price ranges due to illiquidity and infrequent trading in those regions. Those markets will continue to be assessed based on most recent transactions reported to OPIS, market surveys of most recent spread assessments to more liquid markets and the best bid-ask spread available through brokers and electronic exchanges.
Editors have the ability to review and reflect transactions reached on electronic platforms, such as ICE, within published ranges, but posted “bid/asked” numbers or even confirmed deals on such networks are viewed subjectively by OPIS staff. It is up to individual OPIS editors to determine whether prices quoted on electronic platforms fall within the reasonable realm of where business is being done — OPIS will not include a price within its daily ranges simply because it appeared on an electronic platform. Finally, a note about errors and disputes. We recognize that ascertaining a spot product range is highly subjective, and realize that there will be parties that dispute our “call.” Ranges are only changed in the case of clerical errors such as typos or transpositional mistakes. We never alter ranges simply because of oil firm complaints.
OPIS Transatlantic ARB: Mont Belvieu/cif Flushing
In the northwest European propane market, OPIS assesses cargoes basis CIF Flushing for 10-25 days forward delivery. The grade and quality, delivery and nomination terms are based on the prevailing, industry-accepted forward contract, such as the TOT contract. Positions referencing alternative forward delivery contracts will be considered if the dates fall into the 10-25 day forward delivery range. Assessments consider physical spot deals and swaps transacted between 4:00-4:30pm London time. Butane prices are for field grade mixed butane cargoes above 4,000mt delivered 5-20 days forward basis cif ARA.
At Mont Belvieu, propane and butane prices are non-TET any current month daily averages.
OPIS International LPG VLGC Freight Rates
OPIS surveys a wide range of market participants to create a daily LPG freight assessment for Very Large Gas Carriers. The freight assessment is quoted in a dollar-per-ton basis.
While OPIS considers the bids, offers and transaction levels within a prevailing assessment cycle, market indications received outside the prevailing cycle and standard terms can also be considered in the event of an illiquid market.
Standard terms for the assessment are as follows:
Route:
OPIS FOB USGC Resale Differentials
OPIS assesses Very Large Gas Carrier (VLGC) size cargoes of fully-refrigerated propane loading FOB at U.S. Gulf Coast terminals (Enterprise, Targa, Nederland and Freeport) for two forward half-month cycles. Specification is export-grade low-ethane propane (maximum 2% ethane). Editors survey a range of market participants and assessments will be based on executed deals, bid-offer levels and netbacks to the Far East and Northwest Europe. Half-month cycles roll at the new calendar month and at mid-month. The assessment is reported as a differential range (cts/gal) to OPIS Mont Belvieu non-TET (EPC) propane value on the day. Editors confirm and record deals done between 9am and 2pm U.S. Eastern time (2pm and 7pm U.K. time).
Consideration of Calendar and Product-Spread Transactions
In general, editors may disregard the prices for two-party calendar spreads. However, editors do consider the differential implied by such transactions. For instance, if two firms agreed to exchange Mt. Belvieu ethane for the current month versus the out month, at a differential of 1cts/gal, the editor would consider that differential in the day’s assessment of the market.
In the case of a three-party spread – one in which firm A completes a calendar spread by selling to Firm B and buying from Firm C in different months – editors may consider the prices as well as the monthly differential when computing the day’s ranges.
Editors may consider both the prices and differentials achieved in a product spread (such as ethane for EP mix) or geographical spread (such as Conway propane for Mt. Belvieu Non-TET propane).
Specifications
OPIS NGL spot market products offer twice-a-day market assessments – at midday and following the futures’ market’s close at the end of a business day for Mont Belvieu and Conway markets, with once daily assessments offered for all other markets. In addition to in-depth market analysis that explains what factors are influencing price direction, OPIS provides a range of actual spot prices, reporting a daily market “low,” “high,” “average” for each of the products in each of these markets: Mont Belvieu, Texas; Conway and Bushton, Kan.; Napoleonville and Geismar/Sorrento, La.; Hattiesburg, Miss.; Los Angeles, Bakersfield, and San Francisco, Calif. and Sarnia and Edmonton, Canada. Averages are simple averages of the daily low and high, as opposed to weighted averages.
In Mont Belvieu markets, TET prices apply to product traded in the original TET facility currently owned by the Energy Transfer LP and Regency Energy Partners LP joint venture, (LST). Non-TET prices only apply to product traded in the Mont Belvieu Caverns facility that is a subsidiary of Enterprise Products Partners, LP. Other Non-TET prices apply to product traded in Targa Resources storage. EP Mix and Purity Ethane apply to those products traded in the Mont Belvieu Caverns facility that is a subsidiary of Enterprise Products Partners, LP.
OPIS Mont Belvieu Spot Gas Liquids Aggregate Prices
The aggregate prices are automated prices based on and derived from the daily assessed lows and highs of each product from the OPIS Mont Belvieu Spot Gas Liquids Prices. The aggregate low and high prices will both be rounded to the nearest thousandth, while the aggregate average price and aggregate month to date price will be rounded to the nearest ten thousandth for “Any Current Month”, “Prompt Current Month” and “Out Month” for each product and will be calculated and reported as follows:
For the daily aggregate propane, isobutane and natural gasoline prices, OPIS will calculate the average of the daily assessed spot lows for TET, Non-TET and Other Non-TET for their respective product, to provide the aggregate low, and the average of the daily assessed spot highs for TET, Non-TET and Other Non-TET for their respective product, to provide the aggregate high.
For the daily aggregate normal butane prices, OPIS will calculate the average of the daily assessed spot lows for TET, TET Isomerization Grade (Isom), Non-TET and Other Non-TET normal butane to provide the aggregate low, and the average of the daily assessed spot highs for TET, TET Isomerization Grade (Isom), Non-TET and Other Non-TET normal butane to provide the aggregate high.
For the daily aggregate EP mix prices, OPIS will calculate the average of the daily assessed spot lows for EP mix and Other Non-TET EP mix to provide the aggregate low, and the average of the daily assessed spot highs for EP mix and Other Non-TET EP mix to provide the aggregate high.
For the daily aggregate purity ethane prices, OPIS will calculate the average of the daily assessed spot lows for purity ethane and Other Non-TET purity ethane to provide the aggregate low, and the average of the daily assessed spot highs for purity ethane and Other Non-TET purity ethane to provide the aggregate high.
For all products, the daily aggregate average price will be calculated by averaging the daily aggregate low price with the daily aggregate high price for each product. The daily month to date aggregate price will be calculated by averaging the daily aggregate averages for that month for each product.
NGL Basket OPIS MB Non-TET
This index is an automated composite price representing the components of y-grade, or raw make, based on the percentage content of the stream as such: 42% NGL-MONT BELVIEU Purity Ethane-OPIS; 28% NGL-MONT BELVIEU Propane (NON-TET)-OPIS; 11% NGL-MONT BELVIEU Normal Butane (NON-TET)-OPIS; 6% NGL MONT BELVIEU Isobutane (NON-TET)-OPIS; 13% MONT BELVIEU Natural Gasoline (NON-TET)-OPIS. The price is based on the daily averages of Non-TET any current month product prices which are traded in the Mont Belvieu Caverns facility that is a subsidiary of Enterprise Products Partners, LP and published daily in the OPIS North America LPG Report. It is priced in US cents/gal and $/bbl.
Unless otherwise noted all prices refer to product traded on an in-well basis.
Accepted industry standards:
c3 (propane) 90,830 btu/gal, .507 relative density, liquid
nc4 (normal butane) 102,916 btu/gal, .584 relative density liquid
Note: In Mt. Belvieu TET (LST) normal butane references refinery grade butane regardless of location. Non-TET and Other non-TET normal butane refer to isomerization grade normal butane. Conway prices reflect the market for isomerization grade normal butane.
ic4 (isobutane) 98,950 btu/gal, .563 relative density liquid
c5 (natural gasoline) 115,021 btu/gal, .664 relative density liquid
Mixed and field grade products vary depending on market conditions, the gas stream or crude slate from which they are obtained, and no specs are available as these are not deemed fungible and are tested on a per batch basis.
OPIS FOB Southeast Louisiana Spot Gas Liquids Aggregate Prices (cts/gal)
The aggregate prices are automated prices based on and derived from the daily assessed lows and highs of each product from the OPIS FOB Napoleonville and Geismar/Sorrento Area Spot Gas Liquids Prices. The aggregate low and high prices will both be rounded to the nearest thousandth, while the aggregate average price and aggregate month to date price will be rounded to the nearest ten thousandth for “Any Current Month”, “Prompt Current Month” and “Out Month” for each product and will be calculated and reported as follows:
The daily OPIS FOB Southeast Louisiana Spot Gas Liquids Aggregate Prices for “Any Current Month” would be calculated by averaging the FOB Napoleonville and FOB Geismar/Sorrento Area spot lows assessed for that day, averaging the FOB Napoleonville and FOB Geismar/Sorrento Area spot highs assessed for that day, and the aggregate average would be based on the aggregate low and aggregate high. The aggregate month to date average would be the average of the daily aggregate averages for that month. These same calculations would be used for “Prompt Current Month” and “Out Month” using the associated prices from OPIS FOB Napoleonville and FOB Geismar/Sorrento Area Spot Gas Liquids Prices.
Canadian LPG Prices
As of July 11, 2011, OPIS began assessing Canadian LPG markets on a daily basis.
Editors track any, prompt and out month prices for Edmonton propane, field grade butane and natural gasoline; and for Sarnia propane, normal butane and isobutane.
Assessments reflect spot prices in each location. Local posted prices are, however, taken into consideration to determine market value in the absence of spot liquidity.
Prices are typically collected from 9 a.m. to 4 p.m. Eastern Time.
Edmonton: OPIS assesses Edmonton area in-well transactions for spot propane and field-grade butane.
In the case of natural gasoline, the spot location is Fort Saskatchewan Pipeline. Smaller-sized pipeline activity in the Edmonton natural gasoline market is taken into account for directional purposes only.
Typical minimum transaction volumes in Edmonton are as follows: Edmonton propane, 1,000 cubic meters; field-grade butane, approximately 500 cubic meters; natural gasoline, 1,000 cubic meters. However, OPIS will consider smaller-volume parcels to gauge market direction in the absence of liquidity. There is no absolute minimum volume requirement that OPIS adheres to in making its Edmonton assessments.
All prices are assessed in cents per gallon in the daily OPIS North America LPG report, though price reporting on the part of market participants often follows different formats. Data received is converted to cents per gallon.
For less liquid markets, OPIS editors rely on historically verifiable market relationships and traditional differentials such as:
In addition to the cents per gallon assessment in its report, OPIS tracks the dollars per barrel premium or discount to WTI crude oil for Edmonton natural gasoline.
Sarnia:
OPIS assesses Sarnia area in-well transactions for spot propane, as well as normal butane and isobutane.
In the case of these products, the primary spot locations assessed are the Plains Sarnia fractionator and the Pembina Sarnia storage facility; both are facilities to which OPIS intends to refer when using the term “Sarnia”.
Typical minimum transaction volumes in Sarnia are 7,500-10,000 bbl, however, OPIS will consider smaller-volume parcels to gauge market direction in the absence of liquidity. There is no absolute minimum volume requirement that OPIS adheres to in making its Sarnia assessments.
All prices are assessed in cents per gallon in the daily report, though price reporting on the part of market participants often follows different formats. Data received is converted to cents per gallon.
For less liquid markets, OPIS editors rely on historically verifiable market relationships and traditional differentials such as:
West Coast
As of Oct. 1, 2014, OPIS began assessing West Coast LPG markets on a daily basis. Editors track any month prices for Bakersfield propane, normal butane, butane mix and natural gasoline; San Francisco and Los Angeles propane, normal butane, butane mix and isobutane. Assessments reflect spot prices in each location. Local posted prices are, however, taken into consideration to determine market value in the absence of spot liquidity. Propane is quoted at fixed prices, FOB terminals in U.S. cents/gallon, excluding taxes and discounts. Normal butane and isobutane are quoted at differentials to Mont Belvieu non-TET grades, delivered basis to refineries in U.S. cents/gallon. Natural gasoline is quoted at a differential to WTI averages, delivered basis to refineries in U.S. cents/gallon.
Starting May 1, 2015, OPIS has defined West Coast market regions as follows: the Los Angeles region shall encompass racks in Los Angeles County, San Bernardino County, Orange County and Riverside County. The San Francisco region shall encompass racks in Contra Costa County and Solano County. The Bakersfield region shall encompass racks in Kern County and Ventura County.
Beginning Jan. 1, 2015, suppliers of propane in California will incur a carbon obligation under the state’s cap-and-trade regulations. In order to show compliance, suppliers must purchase California Carbon Allowances (CCAs) and may elect to reflect the cost of those allowances in their rack product postings -also known as Cap-at-the-Rack (CAR). OPIS assesses the value of CCAs and calculates the CAR impacts.
Starting Jan. 1, 2015 West Coast NGL spot market assessments based on postings will exclude OPIS posted LPG CAR costs. Some suppliers have indicated they will not include CAR values in their posted prices. Others have indicated that they will. In the latter case, we will adjust (normalize) to “prices without CAR cost” by removing the OPIS Assessed CAR value for suppliers who embed the value into the posted price. If a supplier offers transparency into the actual cost they include for CAR, we will adjust the posted price according to that value and not the OPIS Assessed CAR Value.
In the event that all suppliers include a CAR value in their postings at a particular market, OPIS will adjust those prices to create a normalized rack price from which to base a spot market assessment.
The OPIS Cap-at-the Rack (CAR) cents-per-gallon assessment for each product is calculated using the following formula: CPG = (OPIS daily current year, prompt month CCA assessment mean $/mt x CO2e/gal of obligated fuel) x 100.
Typical minimum volumes for West Coast spot transactions are 30,000 gallons. However, OPIS will consider smaller-volume parcels to gauge market direction in the absence of liquidity. Starting May 1, 2015, OPIS will focus the West Coast spot propane assessment on truck transactions. For normal butane and butane mix, OPIS editors rely on verifiable market relationships and traditional differentials such as the spread to Mt. Belvieu non-TET normal butane for normal butane and butane mix. Editors may consider the spread to Mt. Belvieu non-TET isobutane for San Francisco and Los Angeles isobutane.
Bakersfield natural gasoline is priced as a differential to WTI crude oil averages. In addition to the cents per gallon assessment in its report, OPIS tracks the dollars per barrel premium or discount to WTI crude oil for Bakersfield natural gasoline.
Frac spreads
Frac spreads in the North American LPG Report are calculated using the following formula: [NGL product average price/NGL product heating value] /100 – referenced month NYMEX natural gas futures settle price x 100 x NGL product heating value. As raw mix/y-grade stream compositions vary widely, the frac spreads published by OPIS are intended only as a general guide, and are not specific to any particular stream or site.
OPIS U.S. Gulf Coast FOB LNG Price Assessments ($/MMBtu)
OPIS U.S. Gulf Coast FOB LNG Price Assessments represent the prices of liquefied natural gas traded and/or stored in the operational LNG terminals of the U.S. Gulf Coast with the intent of exporting and only includes U.S. Gulf Coast LNG projects that have reached substantial completion.
The OPIS U.S Gulf Coast FOB LNG Price Assessments will provide three 15-day forward periods of assessments, which include 16-30 days, 31-45 days and 46-60 days. OPIS will publish two prices for these three periods – an outright price for LNG and a differential value for LNG above four base prices.
The first 15-day period (16-30 days) is based on the 1st month of Henry Hub Futures. The second (31-45 days) and third (46-60 days) 15-day periods are based on the 2nd month of Henry Hub Futures. Futures will roll forward to the next month on the day before expiry.
The assessments include volumes of 1,000-1,150 Btu/scf calorific value and cargoes of 130,000-180,000 cubic meters. OPIS, at its discretion may consider including volumes out of this range. All prices are shown in US dollar per millions of British Thermal units ($/MMBtu).
While OPIS market assessors strive to follow the marketplace throughout a full day of trading by constant communication with traders and brokers to discover done deals, bids and offers for differential assessment, final assessments will be compiled by survey and netback calculations for destinations including but not limited to Asia and Europe in absence of bids, offers and deals.
Delivery (all times are ET)
10:30 a.m. Propane Daily
1:30 p.m. NGL/LP Gas Mid-day market update
6:15 p.m. NGL/LP Gas Final Report
OPIS CARBON OFFSET NGL/LPG INDEX METHODOLOGY
The OPIS Carbon Offset NGL/LPG Index reflects prices for natural gas liquids products that are combined with carbon credits, providing an assessment of the cost for deliverable products with emissions offset by carbon credits.
OPIS provides Carbon Offset NGL/LPG prices for ethane, propane and normal butane based on the OPIS global benchmarks, which originate at the Mont Belvieu, Texas, spot trading hub and the FOB Arab Gulf spot trading hub.
The OPIS Carbon Offset NGL/LPG Index is derived from three key elements: OPIS Spot Natural Gas Liquids price assessments, OPIS Core Carbon Credits (CCP) price assessments, and the carbon dioxide equivalent (CO2e) emission factors for fuels.
OPIS Carbon Offset NGL/LPG Index Products:
Mont Belvieu Carbon Offset Ethane
Mont Belvieu Carbon Offset Propane
Mont Belvieu Carbon Offset Normal Butane
FOB Arab Gulf Carbon Offset Propane
FOB Arab Gulf Carbon Offset Normal Butane
OPIS Carbon Offset NGL/LPG Index Timing:
Mont Belvieu TX: Any Current Month
FOB Arab Gulf: Products loading 30-75 days from the date of publication based on three half-month cycles.
Daily Pricing Mechanism:
Mont Belvieu TX: cts/gal and $/mt
FOB Arab Gulf: $/mt
Core Carbon Credits (OPIS CCP):
The OPIS CCP assessment is published daily in the OPIS Global Carbon Offsets Report. Methodology for OPIS carbon credits may be viewed at https://www.opisnet.com/about/methodology/#carbon-market-pricing.
Calculations:
The OPIS Carbon Offset NGL/LPG Index is calculated from the OPIS Mont Belvieu Aggregate Spot Gas Liquids assessments for ethane, propane, and normal butane, which are published daily in the OPIS North America LPG Report, and the FOB Arab Gulf propane and normal butane assessments, which are published daily in the OPIS Asia Naphtha and LPG Report.
Equation: NGL/LPG Physical Spot Prices + [CCP x CO2e] = OPIS Carbon Offset NGL/LPG Index
Example:
Mont Belvieu TX Carbon Offset NGL Index Low = OPIS Any Current Month Aggregate average + OPIS same day Carbon Neutral Fuel Index (CNFI) low price assessment.
Mont Belvieu TX Carbon Offset NGL Index High = OPIS Any Current Month Aggregate average + OPIS same day CNFI high price assessment.
Mont Belvieu TX Carbon Offset NGL Index Average = Average of Carbon Offset NGL Index Low and High.
FOB Arab Gulf Carbon Offset LPG Index Low = OPIS FOB Arab Gulf LPG average + OPIS CNFI low price assessment.
FOB Arab Gulf Carbon Offset LPG Index High = OPIS Arab Gulf LPG average + OPIS CNFI high price assessment.
FOB Arab Gulf Carbon Offset LPG Index Average = Average of Carbon Offset LPG Index Low and High.
Data Collection and Publish:
The OPIS Carbon Offset NGL/LPG Index reflects data collected in North America NGL markets between 9:00 a.m. and 4:00 p.m. Eastern Time; and OPIS Asia LPG prices published by 8:30 a.m. Eastern Time. Global voluntary carbon markets data is collected across multiple time zones for a full trading day, with a deadline of 5:15 p.m. Eastern Time. The Carbon Offset NGL/LPG Index publishes by 6:30 p.m. Eastern Time on OPIS Context.
In the event of a U.S. publishing holiday, FOB Arab Gulf Carbon Offset LPG Index prices will be calculated based on the latest published OPIS CCP prices in the OPIS Global Carbon Offsets Report.
The OPIS daily end-of-day NGL Forwards Report provides a snapshot glimpse of monthly and quarterly forward low, high, and average assessments for Mont Belvieu purity ethane (21 months, 7 quarters), TET propane (21 months, 7 quarters), Conway propane (18 months), non-TET normal butane (18 months), isobutane (18 months), and natural gasoline (18 months), with ranges representing market projections as well as completed transactions.
In addition, the OPIS NGL Forwards Report features ethylene forward cash cost price tables and charts for Mont Belvieu ethane, TET propane, and non-TET normal butane and natural gasoline. These prices combine OPIS NGL pricing (as the raw material for Mont Belvieu ethylene) with OPIS PCW benchmark petrochemical prices. The ethylene forward cash costs are indicators of the price to produce ethylene using the various NGL feedstocks’ values in the forward markets.
Methodology for NGL Forward price assessments. . .
At times, liquidity may be low in gas liquids forward markets and price reporting can be subjective. Therefore, editors gather data from a cross-section of market participants, and any information received pertaining to forward transactions is kept strictly confidential.
OPIS editors have the discretion to exclude forward values that represent extraordinary circumstances or are far outside the range of other values reported on a given day. Prices generally represent volumes of 10,000 bbl or greater at Mont Belvieu and 2,500 bbl or greater at Conway. Editors have the ability to reflect transactions reached on electronic platforms, but will not include a price in daily ranges simply because it appeared on an electronic platform. Prices are only corrected in the case of clerical mistakes and typographical errors.
The forwards prices at each day’s settlement are a confirmation of bids, asks and/or transactions at the time of the NYMEX close.
Fractionation Spreads
Monthly fractionation spreads in the NGL Forwards Report are calculated using the following formula: [NGL product average price/NGL product heating value] /100 – referenced month NYMEX natural gas futures settle price x 100 x NGL product heating value. As raw mix/y-grade stream compositions vary widely, the fractionation spreads published by OPIS are intended only as a general guide, and are not specific to any particular stream or site.
Product Ratios to Crude Oil
The formula for calculating monthly NGLs as a percentage of crude oil is as follows: (PRICE * 42) / ( 2/3rd Cycle WTI + 1/3rd Cycle+1 WTI)
Methodology for OPIS PCW ethylene cash costs and maximum operating rates…
The OPIS PCW Ethylene Cash Costs are derived using formulas based on practices used within the industry related to product yields per feedstock. Input values include OPIS NGLs data and OPIS PCW Olefins data. Methodology used by OPIS PCW to estimate maximum olefins plant operating rates is based on confirmed outages and verified rate reductions. It intends to portray the highest possible rate the industry could operate at using confirmed information.
U.S. Gulf Coast
U.S. Atlantic Coast
U.S. Midwest
U.S. West Coast
Millions of gallons of gasoline, diesel fuel, heating oil, jet fuel, ethanol and other oil products are bought and sold each day in cash bulk markets. Commonly known in the trade as “spot” market prices, these transactions typically occur at the leading oil refining, barge and pipeline centers in the United States. These include the U.S. Gulf Coast, Group 3, Chicago, Atlantic Coast, Los Angeles, San Francisco Bay and Pacific Northwest.
Record Retention Policy
OPIS’s Record Retention Policy requires that the assessor records as a minimum:
Further, OPIS’ Record Retention policy requires that all relevant information, including market assessor notebooks, emails and instant messenger logs are retained for 5 years.
OPIS has a service agreement with a company that provides it with off-site electronic backup of its data.
Assessment communications including back office deal sheets, corrections logs, data exclusion logs and reporters’ worksheets are kept in a centrally accessible SaaS document third-party repository vendor for 5 years, with effect from at least 30 September 2013.
All published spot price assessments are kept in OPIS’s spot assessment database and never erased.
Full-Day Philosophy
OPIS editors track spot markets on a full-day basis and our daily ranges reflect confirmed trades by timing, volume, product and location each day. Editors reserve the right to exclude any deal or deals deemed “not reflective” of prevailing or fair market value. These deals may be mentioned in written commentary, however.
“Typical” trading hours extend from 9:00 a.m. to 5:15 p.m. Eastern Time (6:00 a.m. to 2:15 p.m. Pacific Time), with the exception of the U.S. Atlantic Coast, where trading hours extend from 8:00 a.m. to 5:15 p.m. Eastern Time. In order to meet publication deadlines, deals received by OPIS after 5:15 p.m. (2:15 p.m. Pacific Time) will not be included in the full day’s product ranges.
We recognize ascertaining a spot product range can be subjective, and that there may be parties that dispute our numbers. Assessing markets requires judgment on the part of our editors, but those calls will be reviewed among experienced reporters and within the context of that day’s market. Ranges are only changed in the case of clerical errors such as typos or transposition mistakes.
Definition of “Last” and “Mean”
OPIS Last: The OPIS “Last” is a price indicator of where cash or spot market prices end for each full-day spot market trading session. It provides a numerical approximation of a refined product’s end-of-the day value.
The OPIS “Last” is a market indicator number and DOES NOT necessarily reflect an actual spot market deal transaction. In other words, it DOES NOT necessarily reflect a “Last” trade. Instead, it is designed to indicate the market’s direction at the end of the trading day to help gauge the relative shift in physical values from day to day.
In the absence of an actual confirmed trade, the OPIS “Last” may be included in OPIS’s Full-Day Spot Trading Ranges using a “highest bid/lowest offer” methodology to pinpoint a reasonable number it would take to close a transaction at day’s end.
OPIS Mean: The OPIS Spot “Mean” represents the numerical mid-point of the OPIS “low” and the OPIS “high” calculated using actual spot market deals confirmed by OPIS markets editors during the course of full-day trading.
OPIS spot market transactions are made transparent during the day on the OPIS Deal Log as part of the daily OPIS Spot Ticker.
While the OPIS Spot “Mean” is calculated using actual deal transactions from “low” to “high” during the day, editors do take into account in full-day price assessment end-of-the-day market shifts that potentially indicate new pricing levels.
At times to supplement confirmed deals or in the absence of confirmed deals, OPIS editors use a “highest bid/lowest offer” methodology to assess the new pricing levels as part of the full-day range.
Data Collection
OPIS editors sample on a daily basis a broad cross-section of refiners, traders, marketers, brokers and end users active in buying, selling or trading physical barrels. We cast a wide net to capture as many transactions as possible in arriving at our day-to-day price assessments of spot market values. Editors take an “arm’s length” approach to covering the market.
Editors confirm and record deals done for gasoline and distillate products that meet minimum pipeline/barge volumes specific to each geographic market. As the majority of the market is done on an EFP basis, we follow deals as basis discounts or premiums to the New York Mercantile Exchange. We consider fixed-price deals only if they fall within the full-day differential range based off the NYMEX at settlement, or to assess cash-for-cash “regrade” transactions.
OPIS daily spot market assessments include information obtained from “back office deal logs” sent to us as part of our daily market price discovery. The information highlights actual transactions during the day, including price, volume, product, timing and counter party.
OPIS has signed confidentiality agreements with some providers not to make this information public, except to use the transactions in our daily range of prices and weighted averages providing it meets our volume and timing criteria. OPIS editors compare the end-of-the-day deal logs with our confirmed deals through the day to ensure we do not duplicate information.
Editors respect the wishes of sources to remain anonymous in their activities in the market, and any information we receive regarding parties in deals is kept confidential.
Ranges reflect actual transacted deals. In the case of confirmed trading followed by a shift in the market without a done deal, editors will consider the last deal recorded and weigh it in light of subsequent buyer and seller bids and offers.
In the total absence of confirmed deals, we will use the input of the trading community to help us assess a viable “get-done” range and last value, and also consider the relationship the illiquid product may have with more actively-traded grades.
Typically, the “lowest sell price” and the “highest bid price” will be used to help us arrive at our full-day range.
OPIS U.S. refined spot product assessments reflect trade activity throughout the day. OPIS does not adjust spot market prices to account for taxes and fees, such as the Superfund fee and Oil Spill Liability Trust Fund fee. The value of taxes and fees may be built into spot discounts or premiums to futures by traders in their transactions, but OPIS does not make any further adjustment to its refined spot assessments with reference to these taxes and fees.
Reports
OPIS issues east of the Rockies and West Coast full-day refined product spot reports at approximately 5:30 p.m. Eastern Time, with a final deadline of 6 p.m. Eastern Time.
Ranges in these reports apply the highest and lowest done deal differentials versus the NYMEX at settlement, resulting in an absolute full-day trading range in cents per gallon. We do not round prices up or down.
OPIS ranges track a prompt market east of the Rockies based on pipeline schedules and trading practices specific to each region.
OPIS breaks out a “last” level in addition to its low-to-high range, as a way to give the market a last-seen reference point for the next day’s session.
In addition, OPIS tracks a forward-range based on “any-month timing” for barrels that can be lifted in the same calendar or forward calendar month beyond the prompt cycle.
West Coast reports also track prompt ranges, which are trades that reflect “any month/buyers option” transactions. “Buyers option” gives the buyer the choice of taking delivery in any of the four cycles throughout the month. In Los Angeles, OPIS identifies the prompt Kinder Morgan cycle for timing clarity but ranges are buyer option/any month lifting.
OPIS also issues a Midday Spot Market Report for east of the Rockies markets that is an indication of the morning’s trade based on a NYMEX “freeze” at approximately 11:45 a.m. Eastern Time.
Midday market direction for implied cash prices is important for OPIS customers using this information to make rack pricing decisions. That range is simply an estimate of where the market has been trading or talked in the morning session and is published solely to provide a gauge of where implied absolute prices would be if a snapshot was taken at midday. Due to the incredible volatility in the futures and physical markets, alike, the midday indications are not included in the end-of-day, full-day assessments unless the midday numbers fall into a range covered by the full-day numbers.
OPIS spot methodology for gasoline Reid Vapor Pressure has always designated RVP levels during the spring/summer months when federal and state mandates require lower RVP gasoline. During the fall/winter months, OPIS spot prices have always defaulted to the seasonal RVP requirements. Starting September 2, 2009, OPIS now designates gasoline RVP levels year-round, with designations specific to trading cycles by product by market.
Time Stamp (all times are ET)
Weighted Averages
In response to subscriber requests, OPIS rolled out a weighted average in its full-day reports for selected products. This is an arithmetic mean based on confirmed deals versus the NYMEX, taking into account repeated differentials and volume of trades.
Example of a Weighted Average:
NYMEX close for reference product RB (RBOB) is 225.00cts/gal.
Done deals for Gulf Coast Unleaded Regular (9.0 lbs. RVP M2):
Under this scenario, OPIS’s closing range at the end of the day would be 221.50 – 224.00cts/gal – the midpoint for the day would be 222.75cts/gal.
On this day, the weighted average would be 223.05cts/gal, which is calculated by giving added weight to the larger volume deals: 2x to the -2.25cts/gal and the -1.5cts/gal deals, and by factoring in the number of actual deals into the average. EXAMPLE: the -1ct/gal deal gets entered in four times.
NOTE: for the weighted average, the Gulf Coast minimum deal is 25,000 bbl – those deals are counted once. 50,000 bbl deals are counted twice, and anything between 25,000 and 50,000, or in excess of 50,000 would be calculated at an appropriate percentage of a single piece.
All gasoline grades follow seasonal environmental requirements for RVP. When actively trading, OPIS reports will track ranges for multiple RVPs, for example during transitional periods or in the summer in the Gulf Coast when 9.0-lb. and 7.8-lb. psi specs are seasonal.
The OPIS Spot Ticker is your full-day, real-time window into what U.S. spot prices are doing. OPIS editors throughout the day update the OPIS Spot Ticker with done deals and buy-sell levels tracked in the market. It’s a web-based tool that offers real-time updates of OPIS spot prices and cash market trading differentials in major regions, along with news and events affecting prices.
Differentials are applied to the NYMEX, as it ticks, as an indicator of where the prompt market is valued. Though our full-day trading differentials are applied to the settled NYMEX, the Spot Ticker provides a market view into the numbers we are tracking as the futures market moves.
Deals we confirm are posted throughout the day in the Deal Log to give the market predictability as to where editors will call the full-day differential ranges and weighted averages.
OPIS editors discover deals throughout the day, but some may not be reported to us right after they are done. We make every attempt to list deals in the Deal Log as soon as we discover and confirm them. In an effort to meet our deadlines, some late-received deals may be applied to our ranges and weighted averages once they are confirmed but may not be logged into the Deal Log.
The OPIS Spot Ticker also offers customers overnight implied spot price discovery by linking final-day cash basis trading differentials to the Globex overnight NYMEX ticks. These implied numbers are for directional purposes only to give subscribers an idea of what direction prices are moving after hours. They are not included as a part of any OPIS daily spot range of prices.
Price Discovery
Editors confirm and record deals done for Gulf Coast gasoline and distillate products with a minimum pipeline size of 25,000 bbl and minimum waterborne size of 50,000 bbl.
OPIS tracks a prompt market for southern grade products moving on the Colonial Pipeline, with origin Pasadena, Texas, non-Alabama and waterborne, FOB Gulf Coast. Colonial Pipeline Texas Origin exclusive trades are discarded from our full-day ranges.
Pipeline shipments are scheduled according to cycles. Colonial Pipeline dictates those schedules, and hence, is ultimately the decision maker as to when cycles pump throughout the year. There are 72 cycles each year, lasting approximately five days. Colonial determines the duration of each cycle, which may be shortened, extended or eliminated. Schedules cannot be announced in advance by OPIS because the pipeline updates its calendar throughout the year.
Prompt waterborne assessments run at comparable timing with prompt pipeline ranges.
Cycles differ among different products at any given time. For example, Colonial unleaded regular may be on different cycle timing than Colonial diesel.
OPIS follows three consecutive cycles, starting with the current cycle as “prompt-timing” and continuing with the next two out. In addition, OPIS Gulf Coast coverage tracks a ratable-timing range. Ratable numbers are an average of a full month of cycles. Because this range tracks a full month, during the first cycle of each month, the ratable range will reflect the same month. When the second cycle of the month becomes prompt, the ratable timing switches to the next month. It should be recognized that forward numbers often do not have the same detail of discovery and liquidity as prompt cycles.
OPIS concurrently rolls all specialty grades that typically trade as “regrades” to basis products like conventional unleaded regular, so that timing references are consistent.
Gulf Coast waterborne assessments are calculated by adding to spot prices the cost of getting material to port.
Specifications
OPIS tracks Colonial Pipeline specifications for products in the Gulf Coast. Details can be found at www.colpipe.com.
Pipeline Gasoline
*All gasoline grades follow seasonal environmental requirements for RVP. For the most current RVP requirements, please see the OPIS RVP calendar at https://www.opisnet.com/about/rvp-calendar/
Pipeline Distillates
Waterborne Gasoline
*As with pipeline specifications, all gasoline grades follow seasonal environmental requirements for RVP. For the most current RVP requirements, please see the OPIS RVP calendar at https://www.opisnet.com/about/rvp-calendar/
Waterborne Distillates
Blendstocks
Colonial Pipeline Line Space
Assessments reflect the purchase or sale of line space into Colonial Pipeline from a shipper at origin to a buyer at destination, with a minimum volume of 25,000 bbl. Our assessment tracks material loading into Pasadena, Texas, and offloaded before or upon reaching Greensboro, N.C.
OPIS assesses both a Colonial Pipeline Line 01 (gasoline) and a Colonial Pipeline Line 02 (distillate) assessment. The labels represent where the material was loaded into the pipeline and not which line material will end up in. The assessment includes a low, high, last and mean composed of done or heard deals and positions in the market. The “Line 01” assessment reflects the current gasoline prompt cycle, while the “Line 02” reflects the current cycle for ultra-low-sulfur diesel.
Because up-line allocations can sometimes affect the price of unrestricted line space, OPIS editors reserve the right to exclude any deals or positions that are not representative of the market or cannot be confirmed by counter-parties or independent market observers.
The assessment for line space is based on space trading as a premium or discount to the Colonial Pipeline line tariffs which are levied by the pipeline in cts/gal. The assessment reflects only the space within the line, without taking into account any additional fees, line loss or specific grades of fuel.
Assessments:
Colonial Pipeline Line 01 (CPL Line 01): cts/gal, current cycle for gasoline products
Colonial Pipeline Line 02 (CPL Line 02): cts/gal, current cycle for ultra-low-sulfur diesel
Price Discovery
Editors confirm and record deals for gasoline and distillate fuels via New York Harbor and Boston Harbor waterborne cargoes, New York Harbor barges, Linden Junction via Colonial Pipeline, the Buckeye Pipeline and the Laurel Pipeline. Minimum volume requirements are as follows: NYH and Boston standard-size cargoes reflect volumes of 225,000 barrels, plus or minus 10% at the seller’s option; Linden Junction assessments, refined products delivered via Colonial Pipeline between Greensboro, N.C. and Linden, N.J., reflect minimum volumes of 25,000 barrels; NYH barges and Buckeye Pipeline assessments reflect minimum volumes of 10,000 barrels; and Laurel Pipeline assessments reflect minimum volumes of 8,000 barrels.
New York Harbor
Ranges reflect cargo- and barge-quantity deals. While prompt timing for the New York Harbor barge market is generally regarded as barrels loading same-day and up to three full business days out, OPIS will consider barrels loading up to five full days out, when liquidity is thin.
The forward, or end month, range is based on “any-month timing” for barrels that can be loaded in the same calendar month beyond prompt timing, typically the last three days of a month. In the last few days of the month, OPIS reserves the right to roll coverage forward to the next, more liquid month.
The ratable range is based on traded values that reflect an average of a full month where barrels load throughout the month.
Cargoes in the New York Harbor typically trade as the “front half” or the “back half” of the month, which are later narrowed down to a 5-day delivery period. OPIS will accept barrels delivering in the “front half” of the month for inclusion in the prompt index, and barrels delivering in the “back half” of the month for inclusion in the forward index.
OPIS cargo ranges reflect inside-duty basis.
Specifications
Gasoline
*All gasoline grades follow seasonal environmental requirements for RVP. For the most current RVP requirements, please see the OPIS RVP calendar at https://www.opisnet.com/about/rvp-calendar/
Distillates
Linden Junction
Ranges reflect shipments with a minimum volume of 25,000 barrels for delivery via Colonial Pipeline between Greensboro, N.C., and Linden, N.J. Colonial Pipeline deliveries are scheduled according to cycles, of which there are typically six per month, 72 per year, lasting approximately five days.
“Prompt” Linden Junction assessments reflect the first full shipping cycle before its arrival in Greensboro. OPIS will switch cycles in line with Colonial Pipeline’s transport schedule and modify cycle roll dates in line with any changes made to the cycle timings.
Specifications
OPIS tracks Colonial Pipeline specifications for products in Linden Junction. Details can be found at www.colpipe.com.
Gasoline
*All gasoline grades follow seasonal environmental requirements for RVP. For the most current RVP requirements, please see the OPIS RVP calendar at https://www.opisnet.com/about/rvp-calendar/
Distillates
Buckeye Pipeline
Ranges reflect barrels loading FOB New York Harbor, loading into the Buckeye pipeline at Linden, New Jersey for destinations in New York or Pennsylvania. While prompt timing is generally regarded as barrels loading same-day and up to three full business days out, OPIS will consider barrels loading up to five full days out, when liquidity is thin.
Specifications
Gasoline
*All gasoline grades follow seasonal environmental requirements for RVP. For the most current RVP requirements, please see the OPIS RVP calendar at https://www.opisnet.com/about/rvp-calendar/
Distillates
Laurel Pipeline
Ranges reflect non-Pennsylvania-origin barrels loading FOB Philadelphia. Prompt timing includes barrels loading into Laurel Pipeline up to nine full business days out. When no cycles are scheduled up to nine days out for a given product, the next cycle to schedule for that product will be included in the prompt spot price assessment.
Specifications
Gasoline
*All gasoline grades follow seasonal environmental requirements for RVP. For the most current RVP requirements, please see the OPIS RVP calendar at https://www.opisnet.com/about/rvp-calendar/
Distillates
Boston Harbor
Ranges reflect cargoes delivering into the Boston Harbor, via the Chelsea Creek. Vessels entering the creek must be no greater than 660′-6″ in length, no greater than 90′-6″ in beam and no deeper than 36′ in draft.
Cargoes in the Boston Harbor typically trade as the “front half” or the “back half” of the month, which are later narrowed down to a five-day delivery period.
Specifications
Gasoline
*All gasoline grades follow seasonal environmental requirements for RVP. For the most current RVP requirements, please see the OPIS RVP calendar at https://www.opisnet.com/about/rvp-calendar/
Distillates
Residual Fuel
Listings represent cargo transactions for delivery in the East Coast region, centered around the N.Y. Harbor. Sulfur maximums of 0.3% HP, 1.0% and 3% and higher are covered. HP, or High Pour, indicates material with over 65 degrees F. maximum.
Price Discovery
Editors confirm and record deals done for gasoline and distillate products with a minimum size of 5,000 bbl in the Group 3 market and a minimum of 10,000 bbl for all Chicago markets.
Group 3
OPIS tracks the Group 3 market following deals for prompt delivery, same-day and next-day deals, at product FOB Central Oklahoma locations for shipment on the Magellan Pipeline. In addition, OPIS tracks a forward range based on “any-month timing” for barrels that can be lifted in the same calendar month beyond prompt timing, typically the last five days of a month. In the last few days of the month, OPIS reserves the right to roll coverage forward to the next, more liquid month.
Specifications
OPIS tracks Magellan Pipeline specifications for products in the Group 3.
Gasoline
*All gasoline grades follow seasonal environmental requirements for RVP. For the most current RVP requirements, please see the OPIS RVP calendar at https://www.opisnet.com/about/rvp-calendar/
Distillates
Chicago Comprehensive
OPIS’s Chicago comprehensive market includes deals with seller’s option, delivered FOB Chicago area pipelines. Deals confirmed for specified pipeline delivery or storage locations in the region, such as West Shore, Badger, Wolverine and Buckeye Complex, are evaluated for assessment purposes. There are three cycles each month which advance on the 5th, 15th, and 25th. OPIS follows four consecutive cycles, starting with the current cycle as “prompt-timing” and continuing with the next three out. The last cycle in each month (“Cycle 3”) is designated as “any-timing” except when Cycle 3 is the prompt cycle. In that case, the next calendar month’s Cycle 3 will be designated as “any-timing.”
Specifications
Gasoline
*All gasoline grades follow seasonal environmental requirements for RVP. For the most current RVP requirements, please see the OPIS RVP calendar at https://www.opisnet.com/about/rvp-calendar/
Distillates
Buckeye Complex
OPIS tracks the Buckeye Complex market following prompt-cycle trades for Buckeye Complex, off Explorer Pipeline or the CITGO East Chicago storage terminal. Buckeye Complex will adhere to the Chicago Comprehensive cycle schedule, but a Buckeye Complex location-specific assessment will only be made for the prompt cycle.
Specifications
Gasoline
*All gasoline grades follow seasonal environmental requirements for RVP. For the most current RVP requirements, please see the OPIS RVP calendar at https://www.opisnet.com/about/rvp-calendar/
Distillates
Wolverine Pipeline
OPIS tracks Wolverine Pipeline market following prompt-cycle trades for Wolverine Pipeline origin. Wolverine Pipeline will adhere to the Chicago Comprehensive cycle schedule, but a Wolverine Pipeline location-specific assessment will only be made for the prompt cycle.
Specifications
Gasoline
*All gasoline grades follow seasonal environmental requirements for RVP. For the most current RVP requirements, please see the OPIS RVP calendar at https://www.opisnet.com/about/rvp-calendar/
Distillates
West Shore/Badger Pipeline
OPIS tracks the West Shore/Badger Pipeline market following prompt-cycle trades for origin along West Shore Pipeline, Badger Pipeline and Des Plaines storage terminal. West Shore/Badger Pipeline will adhere to the Chicago Comprehensive cycle schedule, but a West Shore/Badger Pipeline location-specific assessment will only be made for the prompt cycle.
Specifications
Gasoline
*All gasoline grades follow seasonal environmental requirements for RVP. For the most current RVP requirements, please see the OPIS RVP calendar at https://www.opisnet.com/about/rvp-calendar/
Distillates
Price Discovery
Editors confirm and record trades for gasoline and distillate products with a minimum pipeline size of 10,000 bbl in Los Angeles; 5,000 bbl in San Francisco and 5,000 bbl in the Pacific Northwest. As the majority of the market is traded on an EFP basis, OPIS assesses the spot market as basis discounts or premiums to the New York Mercantile Exchange (NYMEX). Fixed-price deals are considered only if they fall within the full-day differential range based off the NYMEX at settlement. Fixed price deals are converted to an exchange for physical (EFP) basis when reported and confirmed and then reapplied to the NYMEX settlement price. Trading activity for California markets on a North-South basis will require a volume match between the San Francisco and Los Angeles origins to be considered in the assessment process.
Los Angeles
Gasoline, diesel fuel, and jet fuel physical assessments reflect barrels shipping on Kinder Morgan’s West Line pipeline system with a minimum volume size of 10,000 barrels. The L.A. CARB diesel fuel assessment reflects pipeline trades with a GATX storage facility option. The L.A. jet fuel assessment reflects pipeline trades that include a pump-over option to the Los Angeles International Airport storage facility (LAX). Physical spot market assessments are published as both a differential and an outright price.
Timing: Prompt and forward timing assessments reflect trades that are “any month / buyer’s option” transactions. The spot buyer has the choice of taking product delivery during any of the four pipeline cycles on the Kinder Morgan regional pipeline system throughout the scheduling month. Low carbon fuel standard obligations are passed on to the spot buyer with each pipeline shipment.
OPIS works with Kinder Morgan to determine the pricing month’s roll timing for gasoline and diesel fuel each month. There are four pumping cycles during each month on the Kinder Morgan Pipeline for a total 48 cycles per year. The timing of each cycle is fluid from month-to-month. The scheduling date for each month’s fourth pipeline cycle marks the trade freeze for gasoline and diesel fuel, and a prompt timing roll will take place on the following business day. If the freeze date falls on a weekend or publishing holiday, the timing roll will take place on the following business day. Typically, for Los Angeles, diesel fuel prompt timing rolls between the 16th and 20th of the month, while gasoline typically rolls between the 21st and 25th of the month.
Los Angeles jet fuel prompt timing rolls eight calendar days before the end of the month. If the eighth calendar day falls on a weekend or a publishing holiday, L.A. jet fuel prompt timing rolls on the following business day. In cases where it is close to the end of the month’s trading cycle, OPIS reserves the right to roll coverage forward to the more liquid month.
RVP: OPIS’ Los Angeles gasoline assessments follow the RVP schedule for Kinder Morgan’s West Line pipeline system. During L.A. CARBOB’s transition from high-RVP to low-RVP, OPIS prompt prices will represent a cycle-specific, high-RVP gasoline blend through the end of the first cycle of February on Kinder Morgan’s West Line pipeline system. After the first pipeline cycle in February freezes, OPIS prompt CARBOB assessments will revert back to “any-month” pricing.
When prompt L.A. CARBOB assessments reflect the February first cycle only, high-RVP gasoline specification, the first forward physical price assessment will be reflective of a February “any-timing” low-RVP L.A. CARBOB until the prompt market transitions to the low-RVP gasoline specification at the beginning of February’s second pipeline cycle.
Daily Pricing Mechanism: cts/gal
Products:
Gasoline
*All gasoline grades follow Kinder Morgan Pipeline seasonal environmental requirements.
Distillates
West Line Line Space: Line space for gasoline and diesel fuel originating Los Angeles with delivery into Phoenix, Arizona. Minimum volume requirement is 10,000 bbl. Pricing metric is a cash differential cts/gal versus standard pipeline tariffs and fees.
CALNEV Line Space (Las Vegas): Line space for gasoline and diesel fuel originating Los Angeles with delivery into Las Vegas, Nevada. Minimum volume requirement is 5,000 bbl. Pricing metric is a cash differential cts/gal versus standard pipeline tariffs and fees.
San Francisco
Gasoline and distillates physical assessments reflect barrels shipping on Kinder Morgan’s North Line pipeline system with a minimum volume size of 5,000 barrels. Physical spot market assessments are published as both a differential and an outright price.
Timing: Prompt assessments reflect trades that are “any month / buyer’s option” transactions. The spot buyer has the choice of taking product delivery during any of the four pipeline cycles on the Kinder Morgan regional pipeline systems throughout the scheduling month. Low carbon fuel standard obligations are passed on to the spot buyer with each pipeline shipment.
OPIS works with Kinder Morgan to determine the pricing month’s roll timing for gasoline and diesel fuel each. There are four pumping cycles during each month on the Kinder Morgan Pipeline for a total 48 cycles per year. The timing of each cycle is fluid from month-to-month. The schedule date for each month’s fourth pipeline cycle marks the trade freeze for gasoline and diesel fuel, and a prompt timing roll will take place on the following business day. If the freeze date falls on a weekend or publishing holiday, the timing roll will take place on the following business day. Typically, for San Francisco, gasoline prompt timing rolls between the 18th and 24th of the month, while diesel fuel typically rolls between the 21st and 24th of the month.
San Francisco jet fuel prompt rolls eight calendar days before the end of the month. If the eighth calendar day falls on a weekend or a publishing holiday, S.F. jet fuel prompt timing rolls on the following business day. In cases where it is close to the end of the month’s trading cycle, OPIS reserves the right to roll coverage forward to the more liquid month.
RVP: OPIS’ San Francisco gasoline assessments follow the RVP schedule for Kinder Morgan’s North Line-Zero Line pipeline system. During S.F. CARBOB’s transition from high-RVP to low-RVP, OPIS prompt prices will represent a cycle-specific, high-RVP gasoline blend through the end of the first cycle of March on Kinder Morgan’s North Line pipeline system. After the first pipeline cycle in March freezes, OPIS prompt S.F. CARBOB assessments will revert back to “any month” pricing.
When prompt S.F. CARBOB assessments reflect the March first cycle only, high-RVP gasoline specification, the first forward physical price assessment will be reflective of a March “any-timing” low-RVP CARBOB until the prompt market transitions to the low-RVP gasoline specification at the beginning of February’s second pipeline cycle.
Daily Pricing Mechanism: cts/gal
Products:
Gasoline
*All gasoline grades follow Kinder Morgan Pipeline seasonal environmental requirements.
Distillates
North Line Line Space (Reno): Line space for gasoline and diesel fuel originating San Francisco with delivery into Reno, Nevada. Minimum volume requirement is 5,000 bbl. Pricing metric is a cash differential cts/gal versus standard pipeline tariffs and fees.
Pacific Northwest:
OPIS Pacific Northwest gasoline and diesel spot prices reflect an FOB Portland assessment and include trading activity, with a minimum requirement of 5,000 bbl, for products shipping on the Olympic Pipeline as well as trading activity for barrels at the Kinder Morgan Willbridge and Nustar Portland terminals. The Seattle gasoline spot prices reflect an FOB Seattle assessment, with a minimum volume requirement of 5,000 bbl and include trading activity for barrels shipping on the Olympic Pipeline. The Pacific Northwest jet fuel assessment reflects an FOB Seattle barge assessment, with a minimum volume of 5,000 bbl. Physical spot market assessments are published as both a differential and an outright price.
Timing: Prompt, delivering up to five business days, including same-day delivery. The prompt timing rolls on the first business day of the month, and the timing of the NYMEX reference month shift is reflective of trade liquidity.
RVP: Pacific Northwest gasoline assessments follow the RVP schedule for BP’s Olympic Pipeline system. Trades for prompt gasoline at Portland’s regional terminals may be considered in the assessment process during seasonal gasoline RVP transitions.
Daily Pricing Mechanism: cts/gal
Products:
Gasoline
Distillates
Los Angeles Paper
For the Los Angeles paper market, OPIS provides price discovery for CARBOB, CARB diesel fuel and Jet fuel swaps, assessed as a differential only.
Timing: CARBOB paper price discovery includes two forward months, as well as two forward quarters. For CARB diesel and Jet Fuel, paper price discovery includes two forward months and one forward quarter.
Daily Pricing Mechanism: cts/gal
Southern California Rack-to-Retail Trend
In the OPIS U.S. West Coast Spot market report, a rack-to-retail trend snapshot is provided as a tool that can be used through downstream channels to help forecast the trend line for gasoline and diesel fuel rack to retail markets in Southern California. The L.A. CARBOB and L.A. CARB No. 2 oil prices are the daily prompt spot price assessments in those markets. The Basket of Racks price for gasoline combines OPIS Gross Contract Average prices for the Los Angeles and Colton racks for regular CARBRFG Ethanol 10% and includes CAR normalization, valuing the cost of compliance with both CAR and LCFS program. The Basket of Racks price for diesel fuel combines OPIS Gross Contract Average prices for the Los Angeles and Colton racks for CARB ultra-low diesel fuel and includes CAR normalization, valuing the cost of compliance with both CAR and the LCFS program. The retail gasoline and diesel averages represent the most recent price across of Los Angeles, Orange, San Bernardino and Riverside counties.
Alaska North Slope (ANS) Crude Oil
Alaska North Slope (ANS) crude oil delivered into the U.S. West Coast with a minimum volume of 300,000 bbls. API specific gravity is 29°-32° and sulfur should not exceed 1.1%.
Prices: OPIS publishes ANS outright prices in $/bbl considering bids, offers and trades as differentials to NYMEX WTI Calendar Month Average (CMA), NYMEX WTI prompt, ICE Brent CMA and ICE Brent prompt.
Timing: OPIS ANS crude oil prices reflect deliveries within two calendar months from the first publishing day on or after the 10th of each month. For example, on Jan. 10, OPIS ANS prices reflect delivery in March, and on Feb. 10, ANS prices reflect delivery in April.
ICE Brent CMA: OPIS calculates ICE Brent CMA by averaging prompt-month settlements for each trading day of the calendar month up to the date of publish.
NYMEX WTI CMA: OPIS calculates NYMEX WTI CMA by averaging the prompt-month settlements for each trading day of the calendar month up to the date of publish.
California Carbon Allowance (CCA)
OPIS provides daily price discovery for California Carbon Allowances (CCA) created for the state’s cap-and-trade regulations that are being traded in the marketplace.
Products:
Timing:
Minimum volume: 10,000 metric tons.
Daily Pricing Mechanism: $/metric ton.
California Cap-at-the-Rack (CAR)
OPIS provides a daily price for the estimated impact of cap-and-trade regulations on gasoline and diesel fuel delivered at each California rack. California’s cap-and-trade regulations officially impact the California rack market beginning January 1, 2015; OPIS began publishing the CAR price August 1, 2014, ahead of the regulation compliance start date.
Products:
Timing: Current day pricing based on the OPIS CCA Current Year Vintage prompt timing assessment. OPIS will also provide a week average and a 30-day average for CAR assessment prices.
Daily Pricing Mechanism: Cents-per-gallon; LNG CAR prices are cents-per diesel gallon equivalent (DGE)
Calculation: OPIS uses its assessment for California Carbon Allowances (CCA) to calculate a daily cents-per-gallon cap-at-the-rack value based on the following carbon dioxide equivalent (CO2e) emissions for obligated fuels delivered at California racks:
Carbon Emissions Equivalent Calculations per Gallon for Gasoline & Ethanol
| Summer CARBOB | Winter CARBOB | Ethanol | ULSD No.2 | Biodiesel | LPG | LNG/DGE |
| Reg 0.00893 | Reg 0.00891 | 0.00022 | 0.01024 | 0.00001 | 0.00582 | 0.00732 |
| Mid 0.00891 | Mid 0.00891 | |||||
| Prem 0.00890 | Prem 0.00892 |
Carbon Emissions Equivalent Calculations per Gallon for Diesel Fuels
| ULSD No.2 CO2e | Biodiesel CO2e |
| 0.01024 | 0.00001 |
*Source: California Air Resources Board
The LNG CO2e/DGE value of 0.00732 is defined by the following equations:
LNG CO2e/MMBtu = 0.053072
LNG MMBtu/DGE = 7.25 DGE
LNG CO2e/DGE = 0.053072 ÷ 7.25
LNG CO2e/DGE = 0.00732
The OPIS Cap-at-the Rack (CAR) cents-per-gallon assessment for each product is calculated using the following formula: CPG = OPIS daily current year, prompt month CCA assessment mean $/mt x CO2e/gal of obligated fuel.
Since biomass derived fuels have a compliance obligation under the California cap-and-trade program, OPIS considers the CO2e/gal values for those products when calculating the CAR price for blended gasoline and biodiesel delivered at the rack.
The assessment for CAR gasoline prices (CARB RFG) = 90% gasoline grade’s CO2e/gal x the prompt CCA assessment + 10% ethanol CO2e/gal x the prompt CCA assessment.
The assessment for CAR biodiesel prices (B5) = 95% CARB diesel CO2e/gal x the prompt CCA assessment + 5% biodiesel CO2e/gal x the prompt CCA assessment.
CAR Gasoline RVP schedule: The schedule for determining winter or summer blend gasoline CAR calculations at each rack terminal will be determined by the following RVP cap limits and dates set for each air basin in California’s Reformulated Gasoline Regulations. OPIS reserves the right to publish seasonal CAR gasoline prices at each terminal, reflecting vapor pressure specifications based on actual supply availability, which can fluctuate during transition months, apart from the air district’s mandated RVP date.
| Air Basin | Summer | Winter* |
|---|---|---|
| Mojave Desert | March 1 | November 1 |
| North Coast | May 1 | October 1 |
| Sacramento Valley | April 1 | November 1 |
| Salton Sea | March 1 | November 1 |
| San Diego | March 1 | November 1 |
| San Francisco Bay | April 1 | November 1 |
| San Joaquin Valley | April 1 | November 1 |
| South Central Coast | May 1 | November 1 |
| South Coast | March 1 | November 1 |
Twice a year during the RVP transition periods, OPIS will publish a CAR price assessment for both winter and summer gasoline grades in the West Coast Spot market reports. Both gasoline seasonal CAR price assessments will be published September 28, 29 or 30-October 31 and February 27, 28 or 29-April 30.
*Effective Oct. 5th, 2023, after the OPIS Closing Benchmark is set, OPIS will begin referencing the winter RVP specification for CAR Normalization of gasoline for all air basins. Except for the North Coast Air Basin, which uses winter RVP specifications on Oct. 1st each year, this change is being done early, following a regulatory advisory from the California Air Resource Board and a shipping notice we received confirming adherence to the change. As a result, all air basins will reflect winter values in CAR calculations effective on Oct. 5th in normalized wholesale reports published after the OPIS Closing Benchmark.
Price Discovery
The OPIS Mexico Fuels Report provides a daily price index that assesses the value of Mexico delivered fuels, based on the daily OPIS assessments for U.S. benchmark refined product spot markets. The report also provides Mexico RVP and octane blend value differential assessments, prices for Mexico wholesale markets, spot-to-wholesale arbitrage heat maps, and price assessments for Americas freight rates. The daily OPIS Mexico Fuels Report features news, analysis, and pricing transparency into the buildup cost of importing fuel from the U.S. into Mexico.
The OPIS Mexico Fuels Report provides pricing in U.S. cents per gallon (US¢/Gal), Mexico pesos per liter (MXN$/L), and U.S. dollars per ton (US $/T).
Exchange Rate
For all currency conversions, OPIS uses the Banco de Mexico FIX exchange rate.
OPIS Mexico Waterborne Landed Spot Gasoline Prices
Waterborne landed spot gasoline prices combine OPIS U.S. benchmark pipeline gasoline spot price assessments, OPIS assessed RVP and Octane differentials, OPIS Americas Clean Freight assessments, logistical costs, and removes the OPIS assessed U.S. Renewable Volume Obligation to provide a fuel price index for Mexico ports and CRE RVP regions.
East Coast Mexico: Tuxpan, Tampico, Pajaritos, Progreso, Veracruz and Ciudad Madero
U.S. Gulf Coast Source
Lazaro Cardenas
U.S. Gulf Coast Source
Los Angeles Source
Pacific Northwest Source
Rosarito
U.S. Gulf Coast Source
Los Angeles Source
Pacific Northwest Source
Guaymas
U.S. Gulf Coast Source
Los Angeles Source
Pacific Northwest Source
Topolobampo
U.S. Gulf Coast Source
Los Angeles Source
Pacific Northwest Source
Waterborne Logistics: Fixed cost 1.25 US¢/Gal, reviewed annually.
Renewable Volume Obligation (RVO): OPIS Mexico Waterborne Landed Spot Gasoline prices remove 100% of the OPIS current year, prompt RVO assessment (see methodology OPIS Biofuels / RIN Credits).
Mexico RVP Differential: OPIS calculates the RVP price difference between Mexico CRE regulated seasonal RVP gasoline per region and the OPIS benchmark tradable spec RVP gasoline pipeline assessments for source spot markets based on the IHS Markit blend value equation. The OPIS RVP Differential calculation utilizes assessments and specifications for OPIS benchmark regular and premium gasoline in the source spot markets as well as the OPIS benchmark spot price assessment for Mt. Belvieu Non-TET butane. The Mexico RVP Differential is added to the OPIS price assessment for regular unleaded and regular sub-octane in the U.S. source spot market.
RVP Diff = Frvp* [(P opis regular – P opis butane) + Foct* (P opis premium – P opis regular)]
Frvp = RVP 1.25 Mexico – RVP 1.25 OPIS regular / RVP 1.25 opis regular – RVP 1.25 butane
Foct = Octane butane – Octane opis regular / Octane opis premium – Octane opis regular
Mexico Octane Differential: OPIS calculates the octane price difference between Mexico CRE regulated regular and premium gasoline and OPIS benchmark tradable spec pipeline gasoline assessments for source spot markets using the IHS Markit blend value equation. The Octane Differential is added to the OPIS price assessments for regular unleaded and regular sub-octane in the U.S. source spot market, where applicable.
Octane Diff = (Octane mexico – Octane opis regular / Octane opis premium – Octane opis regular ) * (P opis premium – P opis regular)
Methodology for source OPIS U.S. refined products benchmark prices:
OPIS Mexico Waterborne Landed Spot Distillates Prices
Waterborne landed spot diesel fuel prices and landed spot jet fuel prices combine OPIS U.S. benchmark spot price assessments, OPIS Americas Clean Freight assessments, logistical costs, and removes the OPIS assessed U.S. Renewable Volume Obligation (diesel fuel only) to provide a fuel price index for Mexico marine ports.
East Coast Mexico: Tuxpan, Tampico, Pajaritos, Progreso, Veracruz and Ciudad Madero
U.S. Gulf Coast Source
Lazaro Cardenas
U.S. Gulf Coast Source
Los Angeles Source
Pacific Northwest Source
Rosarito
U.S. Gulf Coast Source
Los Angeles Source
Pacific Northwest Source
Guaymas
U.S. Gulf Coast Source
Los Angeles Source
Pacific Northwest Source
Topolobampo
U.S. Gulf Coast Source
Los Angeles Source
Pacific Northwest Source
Waterborne Logistics: Fixed cost 1.25 US¢/Gal, reviewed annually.
Renewable Volume Obligation (RVO)%: OPIS Mexico waterborne landed spot diesel Fuel prices remove 100% of the OPIS current year, prompt RVO assessment (see methodology OPIS Biofuels / RIN Credits). OPIS Mexico waterborne landed spot jet fuel prices do not remove RVO.
Methodology for source OPIS U.S. refined products benchmark prices:
OPIS Oxygenates Spot Distillates Prices
Oxygenates landed spot prices combine OPIS U.S. Gulf Coast benchmark MTBE spot price assessments, OPIS assessed Mexico Rail Rates or OPIS Americas Clean Freight Rates.
Delivered Monterrey, manifest
Houston Source
Delivered Guadalajara, manifest
Houston Source
Delivered East Coast Mexico, waterborne
U.S. Gulf Coast Source
OPIS Mexico Rail Landed Spot Refined Products Prices
Rail landed spot gasoline prices combine OPIS U.S. benchmark pipeline gasoline spot price assessments, OPIS assessed RVP and Octane differentials, OPIS assessed Mexico Rail Rates, and removes a percentage of the OPIS assessed U.S. Renewable Volume Obligation to provide a fuel price index for Mexico rail markets and CRE RVP regions. Rail landed spot diesel fuel prices combine OPIS U.S. benchmark spot price assessments, OPIS average rates for Mexico rail routes, and removes a percentage of the OPIS assessed U.S. Renewable Volume Obligation to provide a fuel price index for Mexico rail markets.
Delivered Brownsville, manifest
Houston Source
Delivered Monterrey, manifest
Houston Source
Delivered San Luis Potosi, manifest
Houston Source
Delivered San Jose Iturbide, manifest
Corpus Christi Source
Renewable Volume Obligation (RVO)%: OPIS Mexico rail landed spot gasoline and diesel fuel prices remove 60% of the OPIS current year, prompt RVO assessment (see methodology OPIS Biofuels / RIN Credits).
Methodology for source OPIS U.S. refined products benchmark prices:
OPIS Mexico Rail Rates
OPIS publishes rates for rail transport of gasoline, diesel and MTBE from Texas to several locations on the Mexico-US border and within Mexico. The rates are updated at the beginning of each month and applied to the daily OPIS Rail Landed Spot price calculations.
The rail routes OPIS asseses on US cents/gal are:
Rail rates include three factors: the route rate, the fuel surcharge and the tank car lease rate.
The route rates are sourced from rail tariffs as well as counterparties or stakeholders involved in or close to the market. The rates assume a tank car on a manifest train with no term contract pricing. If sourcing is unavailable for a route at the time of assessment, OPIS will consider the price changes along other routes as well as the per-mile cost along nearby routes with similar carriers to determine the rate.
Carriers revise their fuel surcharges at the beginning of each month. The OPIS rail rate will incorporate these changes. The lease rates assume a per-month lease rate over a 12-month term with one delivery per month. Refined products rates assume transport in DOT-111 tank cars. MTBE rates assume transport in DOT-R117 tank cars. Accessorial and demurrage charges are not included in the OPIS published rail rate.
OPIS Americas Clean Freight Rates
OPIS assesses daily clean freight rates for Medium-Range (MR) vessels for transporting refined products from the United States to ports in Mexico. Freight rates are published in U.S. dollars (US$) and U.S. dollars per ton (US$/t).
Routes
Pemex Wholesale Prices vs. OPIS U.S. Gulf Coast Spot Price Spread
OPIS provides a daily price spread between Pemex posted wholesale prices and the OPIS U.S. Gulf Coast spot market refined products prices for 75 Mexico terminals. The price spread reveals the arbitrage between the Gulf Coast pipeline spot market and the Pemex posted wholesale markets for regular and premium gasoline as well as ultra-low-sulfur diesel. OPIS also provides a heat map for regular gasoline and ultra-low-sulfur diesel so that fuel suppliers can identify spot-to-wholesale arbitrages at a glance.
Quick Reference: OPIS Waterborne Landed Spot Methodology
East Coast Mexico: Tuxpan, Tampico, Pajaritos, Progreso, Veracruz and Ciudad Madero
| Product | Origin | OPIS Price Basis | CRE RVP | RVP Index | Octane Index | Freight Route | ex-RVO % | WB Logistic | Distribution |
| Reg Unl 87 | USGC | Reg Unl 87 | North | Yes | No | USGC-EC Mex | 100% | Yes | Nuevo León, Chihuahua, Durango, Coahuila, Tamaulipas, San Luis Potosí. |
| Prem Unl 91 | USGC | Reg Unl 87 | North | Yes | Yes | USGC-EC Mex | 100% | Yes | Nuevo León, Chihuahua, Durango, Coahuila, Tamaulipas, San Luis Potosí. |
| Reg Unl 87 | USGC | Reg Unl 87 | Southeast | Yes | No | USGC-EC Mex | 100% | Yes | Veracruz, Campeche, Puebla, Tabasco, Yucatan, Quintana Roo. |
| Prem Unl 91 | USGC | Reg Unl 87 | Southeast | Yes | Yes | USGC-EC Mex | 100% | Yes | Veracruz, Campeche, Puebla, Tabasco, Yucatan, Quintana Roo. |
| Reg Unl 87 | USGC | Reg Unl 87 | Center | Yes | No | USGC-EC Mex | 100% | Yes | Aguascalientes, Jalisco, Guanajuato, Michoacán, Zacatecas, Morelos, Tlaxcala, State of Mexico, Hidalgo, Querétaro. |
| Prem Unl 91 | USGC | Reg Unl 87 | Center | Yes | Yes | USGC-EC Mex | 100% | Yes | Aguascalientes, Jalisco, Guanajuato, Michoacán, Zacatecas, Morelos, Tlaxcala, State of Mexico, Hidalgo, Querétaro. |
| Reg Unl 87 | USGC | Reg Unl 87 | Pacific | Yes | No | USGC-EC Mex | 100% | Yes | Baja California, Baja California Sur, Sonora, Sinaloa, Nayarit, Colima, Guerrero, Oaxaca, Chiapas |
| Prem Unl 91 | USGC | Reg Unl 87 | Pacific | Yes | Yes | USGC-EC Mex | 100% | Yes | Baja California, Baja California Sur, Sonora, Sinaloa, Nayarit, Colima, Guerrero, Oaxaca, Chiapas |
| Reg Unl 87 | USGC | Reg Unl 87 | Mexico City | Yes | No | USGC-EC Mex | 100% | Yes | Mexico City |
| Prem Unl 91 | USGC | Reg Unl 87 | Mexico City | Yes | Yes | USGC-EC Mex | 100% | Yes | Mexico City |
| Reg Unl 87 | USGC | Reg Unl 87 | Guadalajara | Yes | No | USGC-EC Mex | 100% | Yes | Guadalajara |
| Prem Unl 91 | USGC | Reg Unl 87 | Guadalajara | Yes | Yes | USGC-EC Mex | 100% | Yes | Guadalajara |
| ULSD | USGC | ULSD | N/A | N/A | N/A | USGC-EC Mex | 100% | Yes | Mexico |
| Jet | USGC | Jet 54 | N/A | N/A | N/A | USGC-EC Mex | 0% | Yes | Mexico |
| MTBE | USGC | MTBE | N/A | N/A | N/A | USGC-EC Mex | 0% | Yes | Mexico |
Lazaro Cardenas
| Product | Origin | OPIS Price Basis | CRE RVP | RVP Index | Octane Index | Freight Route | ex-RVO % | WB Logistic | Distribution |
| Reg Unl 87 | USGC | Reg Unl | Center | Yes | No | USGC-Lazaro Cardenas | 100% | Yes | Aguascalientes, Jalisco, Guanajuato, Michoacán, Zacatecas, Morelos, Tlaxcala, State of Mexico, Hidalgo, Querétaro. |
| Prem Unl 91 | USGC | Reg Unl | Center | Yes | Yes | USGC-Lazaro Cardenas | 100% | Yes | Aguascalientes, Jalisco, Guanajuato, Michoacán, Zacatecas, Morelos, Tlaxcala, State of Mexico, Hidalgo, Querétaro. |
| Reg Unl 87 | USGC | Reg Unl | Pacific | Yes | No | USGC-Lazaro Cardenas | 100% | Yes | Baja California, Baja California Sur, Sonora, Sinaloa, Nayarit, Colima, Guerrero, Oaxaca, Chiapas |
| Prem Unl 91 | USGC | Reg Unl | Pacific | Yes | Yes | USGC-Lazaro Cardenas | 100% | Yes | Baja California, Baja California Sur, Sonora, Sinaloa, Nayarit, Colima, Guerrero, Oaxaca, Chiapas |
| Reg Unl 87 | USGC | Reg Unl | Guadalajara | Yes | No | USGC-Lazaro Cardenas | 100% | Yes | Guadalajara |
| Prem Unl 91 | USGC | Reg Unl | Guadalajara | Yes | Yes | USGC-Lazaro Cardenas | 100% | Yes | Guadalajara |
| Reg Unl 87 | LA | Sub-oct Reg | Center | Yes | Yes | USWC-Lazaro Cardenas | 100% | Yes | Aguascalientes, Jalisco, Guanajuato, Michoacán, Zacatecas, Morelos, Tlaxcala, State of Mexico, Mexico City, Hidalgo, Querétaro. |
| Prem Unl 91 | LA | Sub-oct Reg | Center | Yes | Yes | USWC-Lazaro Cardenas | 100% | Yes | Aguascalientes, Jalisco, Guanajuato, Michoacán, Zacatecas, Morelos, Tlaxcala, State of Mexico, Mexico City, Hidalgo, Querétaro. |
| Reg Unl 87 | LA | Sub-oct Reg | Pacific | Yes | Yes | USWC-Lazaro Cardenas | 100% | Yes | Baja California, Baja California Sur, Sonora, Sinaloa, Nayarit, Colima, Guerrero, Oaxaca, Chiapas |
| Prem Unl 91 | LA | Sub-oct Reg | Pacific | Yes | Yes | USWC-Lazaro Cardenas | 100% | Yes | Baja California, Baja California Sur, Sonora, Sinaloa, Nayarit, Colima, Guerrero, Oaxaca, Chiapas |
| Reg Unl 87 | LA | Sub-oct Reg | Guadalajara | Yes | Yes | USWC-Lazaro Cardenas | 100% | Yes | Guadalajara |
| Prem Unl 91 | LA | Sub-oct Reg | Guadalajara | Yes | Yes | USWC-Lazaro Cardenas | 100% | Yes | Guadalajara |
| Reg Unl 87 | PNW | Sub-oct Reg | Center | Yes | Yes | USWC-Lazaro Cardenas | 100% | Yes | Aguascalientes, Jalisco, Guanajuato, Michoacán, Zacatecas, Morelos, Tlaxcala, State of Mexico, Hidalgo, Querétaro. |
| Prem Unl 91 | PNW | Sub-oct Reg | Center | Yes | Yes | USWC-Lazaro Cardenas | 100% | Yes | Aguascalientes, Jalisco, Guanajuato, Michoacán, Zacatecas, Morelos, Tlaxcala, State of Mexico, Hidalgo, Querétaro. |
| Reg Unl 87 | PNW | Sub-oct Reg | Pacific | Yes | Yes | USWC-Lazaro Cardenas | 100% | Yes | Baja California, Baja California Sur, Sonora, Sinaloa, Nayarit, Colima, Guerrero, Oaxaca, Chiapas |
| Prem Unl 91 | PNW | Sub-oct Reg | Pacific | Yes | Yes | USWC-Lazaro Cardenas | 100% | Yes | Baja California, Baja California Sur, Sonora, Sinaloa, Nayarit, Colima, Guerrero, Oaxaca, Chiapas |
| Reg Unl 87 | PNW | Sub-oct Reg | Guadalajara | Yes | Yes | USWC-Lazaro Cardenas | 100% | Yes | Guadalajara |
| Prem Unl 91 | PNW | Sub-oct Reg | Guadalajara | Yes | Yes | USWC-Lazaro Cardenas | 100% | Yes | Guadalajara |
| ULSD | USGC | ULSD | N/A | N/A | N/A | USGC-Lazaro Cardenas | 100% | Yes | Mexico |
| ULSD | LA | ULS No. 2 | N/A | N/A | N/A | USWC-Lazaro Cardenas | 100% | Yes | Mexico |
| ULSD | PNW | ULS No. 2 | N/A | N/A | N/A | USWC-Lazaro Cardenas | 100% | Yes | Mexico |
| Jet | USGC | Jet 54 | N/A | N/A | N/A | USGC-Lazaro Cardenas | 0% | Yes | Mexico |
| Jet | LA | Jet-PipeLAX | N/A | N/A | N/A | USWC-Lazaro Cardenas | 0% | Yes | Mexico |
| Jet | PNW | Jet-Pipe | N/A | N/A | N/A | USWC-Lazaro Cardenas | 0% | Yes | Mexico |
Rosarito
| Product | Origin | OPIS Price Basis | CRE RVP | RVP Index | Octane Index | Freight Route | ex-RVO % | WB Logistic | Distribution |
| Reg Unl 87 | USGC | Reg Unl | Pacific | Yes | No | USGC-Rosarito | 100% | Yes | Baja California, Baja California Sur, Sonora, Sinaloa, Nayarit, Colima, Guerrero, Oaxaca, Chiapas |
| Prem Unl 91 | USGC | Reg Unl | Pacific | Yes | Yes | USGC-Rosarito | 100% | Yes | Baja California, Baja California Sur, Sonora, Sinaloa, Nayarit, Colima, Guerrero, Oaxaca, Chiapas |
| Reg Unl 87 | LA | Sub-oct Reg | Pacific | Yes | Yes | USWC-Rosarito | 100% | Yes | Baja California, Baja California Sur, Sonora, Sinaloa, Nayarit, Colima, Guerrero, Oaxaca, Chiapas |
| Prem Unl 91 | LA | Sub-oct Reg | Pacific | Yes | Yes | USWC-Rosarito | 100% | Yes | Baja California, Baja California Sur, Sonora, Sinaloa, Nayarit, Colima, Guerrero, Oaxaca, Chiapas |
| Reg Unl 87 | PNW | Sub-oct Reg | Pacific | Yes | Yes | USWC-Rosarito | 100% | Yes | Baja California, Baja California Sur, Sonora, Sinaloa, Nayarit, Colima, Guerrero, Oaxaca, Chiapas |
| Prem Unl 91 | PNW | Sub-oct Reg | Pacific | Yes | Yes | USWC-Rosarito | 100% | Yes | Baja California, Baja California Sur, Sonora, Sinaloa, Nayarit, Colima, Guerrero, Oaxaca, Chiapas |
| ULSD | USGC | ULSD | N/A | N/A | N/A | USGC-Rosarito | 100% | Yes | Mexico |
| ULSD | LA | ULS No. 2 | N/A | N/A | N/A | USWC-Rosarito | 100% | Yes | Mexico |
| ULSD | PNW | ULS No. 2 | N/A | N/A | N/A | USWC-Rosarito | 100% | Yes | Mexico |
| Jet | USGC | Jet 54 | N/A | N/A | N/A | USGC-Rosarito | 0% | Yes | Mexico |
| Jet | LA | Jet-PipeLAX | N/A | N/A | N/A | USWC-Rosarito | 0% | Yes | Mexico |
| Jet | PNW | Jet-Pipe | N/A | N/A | N/A | USWC-Rosarito | 0% | Yes | Mexico |
Guaymas
| Product | Origin | OPIS Price Basis | CRE RVP | RVP Index | Octane Index | Freight Route | ex-RVO % | WB Logistic | Distribution |
| Reg Unl 87 | USGC | Reg Unl | Pacific | Yes | No | USGC-Guaymas | 100% | Yes | Baja California, Baja California Sur, Sonora, Sinaloa, Nayarit, Colima, Guerrero, Oaxaca, Chiapas |
| Prem Unl 91 | USGC | Reg Unl | Pacific | Yes | Yes | USGC-Guaymas | 100% | Yes | Baja California, Baja California Sur, Sonora, Sinaloa, Nayarit, Colima, Guerrero, Oaxaca, Chiapas |
| Reg Unl 87 | LA | Sub-oct Reg | Pacific | Yes | Yes | USWC-Guaymas | 100% | Yes | Baja California, Baja California Sur, Sonora, Sinaloa, Nayarit, Colima, Guerrero, Oaxaca, Chiapas |
| Prem Unl 91 | LA | Sub-oct Reg | Pacific | Yes | Yes | USWC-Guaymas | 100% | Yes | Baja California, Baja California Sur, Sonora, Sinaloa, Nayarit, Colima, Guerrero, Oaxaca, Chiapas |
| Reg Unl 87 | PNW | Sub-oct Reg | Pacific | Yes | Yes | USWC-Guaymas | 100% | Yes | Baja California, Baja California Sur, Sonora, Sinaloa, Nayarit, Colima, Guerrero, Oaxaca, Chiapas |
| Prem Unl 91 | PNW | Sub-oct Reg | Pacific | Yes | Yes | USWC-Guaymas | 100% | Yes | Baja California, Baja California Sur, Sonora, Sinaloa, Nayarit, Colima, Guerrero, Oaxaca, Chiapas |
| ULSD | USGC | ULSD | N/A | N/A | N/A | USGC-Guaymas | 100% | Yes | Mexico |
| ULSD | LA | ULS No. 2 | N/A | N/A | N/A | USWC-Guaymas | 100% | Yes | Mexico |
| ULSD | PNW | ULS No. 2 | N/A | N/A | N/A | USWC-Guaymas | 100% | Yes | Mexico |
| Jet | USGC | Jet 54 | N/A | N/A | N/A | USGC-Guaymas | 0% | Yes | Mexico |
| Jet | LA | Jet-PipeLAX | N/A | N/A | N/A | USWC-Guaymas | 0% | Yes | Mexico |
| Jet | PNW | Jet-Pipe | N/A | N/A | N/A | USWC-Guaymas | 0% | Yes | Mexico |
Topolobampo
| Product | Origin | OPIS Price Basis | CRE RVP | RVP Index | Octane Index | Freight Route | ex-RVO % | WB Logistic | Distribution |
| Reg Unl 87 | USGC | Reg Unl | Pacific | Yes | No | USGC-Topolobampo | 100% | Yes | Baja California, Baja California Sur, Sonora, Sinaloa, Nayarit, Colima, Guerrero, Oaxaca, Chiapas |
| Prem Unl 91 | USGC | Reg Unl | Pacific | Yes | Yes | USGC-Topolobampo | 100% | Yes | Baja California, Baja California Sur, Sonora, Sinaloa, Nayarit, Colima, Guerrero, Oaxaca, Chiapas |
| Reg Unl 87 | LA | Sub-oct Reg | Pacific | Yes | Yes | USWC-Topolobampo | 100% | Yes | Baja California, Baja California Sur, Sonora, Sinaloa, Nayarit, Colima, Guerrero, Oaxaca, Chiapas |
| Prem Unl 91 | LA | Sub-oct Reg | Pacific | Yes | Yes | USWC-Topolobampo | 100% | Yes | Baja California, Baja California Sur, Sonora, Sinaloa, Nayarit, Colima, Guerrero, Oaxaca, Chiapas |
| Reg Unl 87 | PNW | Sub-oct Reg | Pacific | Yes | Yes | USWC-Topolobampo | 100% | Yes | Baja California, Baja California Sur, Sonora, Sinaloa, Nayarit, Colima, Guerrero, Oaxaca, Chiapas |
| Prem Unl 91 | PNW | Sub-oct Reg | Pacific | Yes | Yes | USWC-Topolobampo | 100% | Yes | Baja California, Baja California Sur, Sonora, Sinaloa, Nayarit, Colima, Guerrero, Oaxaca, Chiapas |
| ULSD | LA | ULSD | N/A | N/A | N/A | USGC-Topolobampo | 100% | Yes | Mexico |
| ULSD | PNW | ULS No. 2 | N/A | N/A | N/A | USWC-Topolobampo | 100% | Yes | Mexico |
| ULSD | USGC | ULS No. 2 | N/A | N/A | N/A | USWC-Topolobampo | 100% | Yes | Mexico |
Quick Reference: OPIS Rail Landed Spot Methodology
| Product | Origin | OPIS Price Basis | CRE RVP | RVP Index | Octane Index | Freight Type | Freight Route | ex-RVO % | Delivery |
| Reg Unl 87 | USGC | Reg Unl | North | Yes | No | Manifest | Houston-Brownsville | 60% | Brownsville |
| Prem Unl 91 | USGC | Reg Unl | North | Yes | Yes | Manifest | Houston-Brownsville | 60% | Brownsville |
| Reg Unl 87 | USGC | Reg Unl | Monterrey | Yes | No | Manifest | Houston-Monterrey | 60% | Monterrey |
| Prem Unl 91 | USGC | Reg Unl | Monterrey | Yes | Yes | Manifest | Houston-Monterrey | 60% | Monterrey |
| Reg Unl 87 | USGC | Reg Unl | North | Yes | No | Manifest | Houston-San Luis Potosi | 60% | San Luis Potosi |
| Prem Unl 91 | USGC | Reg Unl | North | Yes | Yes | Manifest | Houston-San Luis Potosi | 60% | San Luis Potosi |
| Reg Unl 87 | USGC | Reg Unl | Center | Yes | No | Manifest | Corpus Christi-San Jose Iturbide | 60% | San Jose Iturbide |
| Prem Unl 91 | USGC | Reg Unl | Center | Yes | Yes | Manifest | Corpus Christi-San Jose Iturbide | 60% | San Jose Iturbide |
| ULSD | USGC | ULSD | N/A | N/A | N/A | Manifest | Houston-Brownsville | 60% | Brownsville |
| ULSD | USGC | ULSD | N/A | N/A | N/A | Manifest | Houston-Monterrey | 60% | Monterrey |
| ULSD | USGC | ULSD | N/A | N/A | N/A | Manifest | Houston-San Luis Potosi | 60% | San Luis Potosi |
| ULSD | USGC | ULSD | N/A | N/A | N/A | Manifest | Corpus Christi-San Jose Iturbide | 60% | San Jose Iturbide |
| MTBE | USGC | MTBE | N/A | N/A | N/A | Manifest | Houston-Monterrey | 0% | Monterrey |
| MTBE | USGC | MTBE | N/A | N/A | N/A | Manifest | Houston-Guadalajara | 0% | Guadalajara |
Quick Reference: OPIS Americas Clean Freight Rates Methodology
| Route | Origin | Cargo Size | Timing | Destination |
| USGC-EC Mexico | U.S. Gulf Coast port region | 38kt | 3-8 days | Tuxpan, Tampico, Pajaritos, Progreso and Ciudad Madero |
| USGC-Lazaro Cardenas | U.S. Gulf Coast port region | 38kt | 7-10 days | Lazaro Cardenas, Mexico |
| USGC-Rosarito | U.S. Gulf Coast port region | 38kt | 7-15 days | Rosarito, Mexico |
| *USGC-Topolobampo | U.S. Gulf Coast port region | 19kt | 7-15 days | Topolobampo, Mexico |
| *USGC-Guaymas | U.S. Gulf Coast port region | 12kt | 7-15 days | Guaymas, Mexico |
| USWC-Rosarito | Pacific Northwest & California port regions | 38kt | 7-15 days | Rosarito, Mexico |
| USWC-Lazaro Cardenas | Pacific Northwest & California port regions | 38kt | 7-15 days | Lazaro Cardenas, Mexico |
| *USWC-Topolobampo | Pacific Northwest & California port regions | 19kt | 7-15 days | Topolobampo, Mexico |
| *USWC-Guayamas | Pacific Northwest & California port regions | 12kt | 7-15 days | Guaymas, Mexico |
| *considers partial discharge |
Price Discovery
The OPIS Mexico Fuels Report Inventory Ticket Price Snapshot provides a monthly price index that assesses the value of fuel inventory tickets across Mexico based on OPIS calculations. The Mexican government defines fuel inventory tickets as a financial tool that grants ticket buyers the right but not the obligation to buy excess strategic inventories held by the ticket seller to comply with the country’s Public Policy on Minimum Fuel Inventories.
OPIS calculates the fuel inventory ticket prices for both Pemex and private fuel companies.
The report estimates the financial cost of stored inventories using OPIS assessments for Mexico landed refined product spot prices from U.S. markets published in its daily Mexico Fuels Report plus all applicable taxes, average regional fuel prices assessed by OPIS, and the 28-day interbank interest equilibrium rate (TIIE) published by Mexico’s Central Bank (Banxico).
Exchange Rate
OPIS uses the monthly average of Banxico’s 48-hours FIX exchange rate for all currency conversions.
Interest rate
OPIS uses the monthly average 28-day TIIE published by Banxico to calculate the financial cost of inventory tickets.
Units
The OPIS Mexico Fuels Report Inventory Ticket Price Snapshot provides ticket pricing in U.S. dollars per barrel per month (USD/bbl month) and Mexican pesos cents per liter per day (MXN¢/L day). Monthly fuel prices are assessed in U.S. dollars per barrel (USD/bbl) and Mexican pesos per liter (MXN/L).
Ticket and fuel prices are assessed by dividing monthly prices in U.S. dollars per month and dividing them by the number of days in the current month, converting the volume to liters, and exchanging the currency to Mexican pesos.
E.g., daily fuel prices for February will be divided by 28 days, and December daily prices will be calculated based on 31 days.
OPIS Implied Mexico Fuel Inventory Ticket Price Methodology
The OPIS fuel inventory ticket methodology is based on the financial return ticket sellers seek to obtain for the sunk capital held in the form of fuel stored in strategic inventories. The financial return is calculated using Banxico’s 28-day TIIE.
OPIS calculates a fuel inventory ticket price using monthly average price elements from the prior month, including OPIS assessments for Mexico landed refined product spot prices from U.S. markets, applicable taxes, average regional storage prices, and Banxico’s 28-day TIIE.
OPIS calculates low, high and average ticket prices using the low, high and average regional storage fees assessed by OPIS adding the financial cost using the Average monthly average spot price fuel landed in Mexico assessed by OPIS.
OPIS MFIT= Storage Cost+Fuel Price+Applicable Taxes∗TIIE12
Designated Regions for the Compliance of the Public Policy on Minimum Fuel Inventories
OPIS calculates the fuel inventory ticket prices for the different logistic regions designated by Mexico’s Energy Ministry to comply with Mexico’s Public Policy on Minimum Fuel Inventories.
Tickets are calculated considering the OPIS fuel price benchmark for each region as well as the average regional storage fees assessed by OPIS.
Additionally, OPIS calculates a national average price considering the price ranges for tickets in all the other regions.
Mexico’s Logistic Regions Designated by SENER
Northwest: Baja California, Baja California Sur, Sonora, Sinaloa, and Nayarit.
North: Chihuahua and Durango.
Northeast: Coahuila, Nuevo León, San Luis Potosí and Tamaulipas.
West: Zacatecas, Aguascalientes, Jalisco, Guanajuato, Michoacán and Colima.
Centre: Querétaro, Hidalgo, Tlaxcala, Puebla, Morelos, State of Mexico and Mexico City.
Gulf: Veracruz and Tabasco.
South: Guerrero, Oaxaca and Chiapas.
Southeast: Campeche, Yucatán and Quintana Roo.
Regional Storage Assessment
OPIS calculates storage fees for each Mexico’s Energy Ministry designated region based on publicly available data on the fuel storage fees.
OPIS assesses regional storage cost at the end of every month for all private terminals and Pemex Logistic. The average price is calculated using the low and high storage fees in the region.
In the case of Grupo Simsa’s San Jose Iturbide Terminal, which has an integrated public tariff for five days of storage plus offload and loading fees, OPIS assesses its storage fees based on a weighted average using the storage capacity and the fees of all other private rail fuel terminals across Mexico.
Monthly Average Fuel Prices
OPIS calculates the financial return ticket sellers seek to obtain for the sunk capital held in the form of fuel stored in strategic inventories using the OPIS assessments for Mexico landed refined product spot prices from U.S. markets published in the daily OPIS Mexico Fuel Report.
OPIS Benchmark Utilized to Calculate Mexico Fuel Inventory Tickets
Private Fuel Inventory Tickets
*Centre jet fuel prices are calculated by including an adder (based on the differential between East Coast Mexico waterborne landed spot prices for diesel and jet) to the manifest rail landed diesel price in San Jose Iturbide.
Pemex Fuel Inventory Tickets
Product Methodology Table: Private Fuel Inventory Tickets
| Product | SENER Region | OPIS Price Basis | States in Region |
|---|---|---|---|
| Reg Unl 87 | Northeast | Houston rail landed in Monterrey | Coahuila, Nuevo León, San Luis Potosí and Tamaulipas |
| Prem Unl 91 | Northeast | Houston rail landed in Monterrey | Coahuila, Nuevo León, San Luis Potosí and Tamaulipas |
| ULSD | Northeast | Houston rail landed in Monterrey | Coahuila, Nuevo León, San Luis Potosí and Tamaulipas |
| Reg Unl 87 | Centre | Corpus Christi rail landed in San Jose Iturbide | Querétaro, Hidalgo, Tlaxcala, Puebla, Morelos, State of Mexico and Mexico City |
| Prem Unl 91 | Centre | Corpus Christi rail landed in San Jose Iturbide | Querétaro, Hidalgo, Tlaxcala, Puebla, Morelos, State of Mexico and Mexico City |
| ULSD | Centre | Corpus Christi rail landed in San Jose Iturbide | Querétaro, Hidalgo, Tlaxcala, Puebla, Morelos, State of Mexico and Mexico City |
| Jet | Centre | Corpus Christi rail landed in San Jose Iturbide | Querétaro, Hidalgo, Tlaxcala, Puebla, Morelos, State of Mexico and Mexico City |
| Reg Unl 87 | West | Corpus Christi rail landed in San Jose Iturbide | Zacatecas, Aguascalientes, Jalisco, Guanajuato, Michoacán and Colima |
| Prem Unl 91 | West | Corpus Christi rail landed in San Jose Iturbide | Zacatecas, Aguascalientes, Jalisco, Guanajuato, Michoacán and Colima |
| ULSD | West | Corpus Christi rail landed in San Jose Iturbide | Zacatecas, Aguascalientes, Jalisco, Guanajuato, Michoacán and Colima |
| Reg Unl 87 | East | USGC waterborne landed in East Coast Mexico | Tabasco and Veracruz |
| Prem Unl 91 | East | USGC waterborne landed in East Coast Mexico | Tabasco and Veracruz |
| ULSD | East | USGC waterborne landed in East Coast Mexico | Tabasco and Veracruz |
| Jet | East | USGC waterborne landed in East Coast Mexico | Tabasco and Veracruz |
| Reg Unl 87 | Southeast | USGC waterborne landed in East Coast Mexico | Campeche, Yucatán and Quintana Roo |
| Prem Unl 91 | Southeast | USGC waterborne landed in East Coast Mexico | Campeche, Yucatán and Quintana Roo |
| ULSD | Southeast | USGC waterborne landed in East Coast Mexico | Campeche, Yucatán and Quintana Roo |
| Jet | Southeast | USGC waterborne landed in East Coast Mexico | Querétaro, Hidalgo, Tlaxcala, Puebla, Morelos, State of Mexico and Mexico City |
| Reg Unl 87 | National | Average price of tickets in all regions | Encompass all states in Mexico |
| Prem Unl 91 | National | Average price of tickets in all regions | Encompass all states in Mexico |
| ULSD | National | Average price of tickets in all regions | Encompass all states in Mexico |
| Jet | National | Average price of tickets in all regions | Encompass all states in Mexico |
Product Methodology Table: Pemex Fuel Inventory Tickets
| Product | SENER Region | OPIS Price Basis | States in Region |
|---|---|---|---|
| Reg Unl 87 | Northwest | USGC waterborne landed in Rosarito | Baja California, Baja California Sur, Sonora, Sinaloa, and Nayarit |
| Prem Unl 91 | Northwest | USGC waterborne landed in Rosarito | Baja California, Baja California Sur, Sonora, Sinaloa, and Nayarit |
| ULSD | Northwest | USGC waterborne landed in Rosarito | Baja California, Baja California Sur, Sonora, Sinaloa, and Nayarit |
| Reg Unl 87 | North | USGC waterborne landed in East Coast Mexico | Chihuahua and Durango |
| Prem Unl 91 | North | USGC waterborne landed in East Coast Mexico | Chihuahua and Durango |
| ULSD | North | USGC waterborne landed in East Coast Mexico | Chihuahua and Durango |
| Reg Unl 87 | Northeast | USGC waterborne landed in East Coast Mexico | Coahuila, Nuevo León, San Luis Potosí and Tamaulipas |
| Prem Unl 91 | Northeast | USGC waterborne landed in East Coast Mexico | Coahuila, Nuevo León, San Luis Potosí and Tamaulipas |
| ULSD | Northeast | USGC waterborne landed in East Coast Mexico | Coahuila, Nuevo León, San Luis Potosí and Tamaulipas |
| Reg Unl 87 | Centre | USGC waterborne landed in East Coast Mexico | Querétaro, Hidalgo, Tlaxcala, Puebla, Morelos, State of Mexico and Mexico City |
| Prem Unl 91 | Centre | USGC waterborne landed in East Coast Mexico | Querétaro, Hidalgo, Tlaxcala, Puebla, Morelos, State of Mexico and Mexico City |
| ULSD | Centre | USGC waterborne landed in East Coast Mexico | Querétaro, Hidalgo, Tlaxcala, Puebla, Morelos, State of Mexico and Mexico City |
| Reg Unl 87 | West | USGC waterborne landed in Lazaro Cardenas | Zacatecas, Aguascalientes, Jalisco, Guanajuato, Michoacán and Colima |
| Prem Unl 91 | West | USGC waterborne landed in Lazaro Cardenas | Zacatecas, Aguascalientes, Jalisco, Guanajuato, Michoacán and Colima |
| ULSD | West | USGC waterborne landed in Lazaro Cardenas | Zacatecas, Aguascalientes, Jalisco, Guanajuato, Michoacán and Colima |
| Reg Unl 87 | East | USGC waterborne landed in East Coast Mexico | Tabasco and Veracruz |
| Prem Unl 91 | East | USGC waterborne landed in East Coast Mexico | Tabasco and Veracruz |
| ULSD | East | USGC waterborne landed in East Coast Mexico | Tabasco and Veracruz |
| Reg Unl 87 | South | USGC waterborne landed in Lazaro Cardenas | Chiapas, Guerrero and Oaxaca |
| Prem Unl 91 | South | USGC waterborne landed in Lazaro Cardenas | Chiapas, Guerrero and Oaxaca |
| ULSD | South | USGC waterborne landed in Lazaro Cardenas | Chiapas, Guerrero and Oaxaca |
| Reg Unl 87 | Southeast | East Coast Mexico Waterborne | Campeche, Yucatán and Quintana Roo |
| Prem Unl 91 | Southeast | East Coast Mexico Waterborne | Campeche, Yucatán and Quintana Roo |
| ULSD | Southeast | East Coast Mexico Waterborne | Campeche, Yucatán and Quintana Roo |
Price Discovery
OPIS provides daily assessments for global voluntary and compliance carbon markets. The voluntary carbon market pricing includes full-day physical assessments for carbon offset credits for Reducing Emissions from Deforestation and forest Degradation (Voluntary REDD+ Credits) as well as CORSIA-eligible offsets (CEO) for ICAO’s Carbon Offsetting and Reduction Scheme for International Aviation. The compliance carbon market pricing includes full-day physical assessments for California Carbon Allowances (CCA), California Carbon Offsets (CCO), and Regional Greenhouse Gas Initiative Allowances (RGGI) and Washington Carbon Allowances (WCA).
OPIS also provides daily prices that evaluate the transportation and refining industry’s cost of compliance with California’s Cap-and-Trade and Low Carbon Fuels Standard programs as well as Quebec’s Cap-and-Trade program.
OPIS provides daily assessments for the compliance carbon markets in Europe. The compliance carbon market pricing includes full-day assessments for the European Union Emissions Trading System (EU ETS) and the United Kingdom Emissions Trading System (UK ETS).
OPIS provides daily assessments for the compliance and voluntary carbon markets in the Asia Pacific region. The voluntary carbon market pricing includes full-day physical assessments for carbon offset credits for the Australian Carbon Credit Units (ACCU) as well as Korean Offset Credit (KOC). The compliance carbon market pricing includes full-day physical assessments for the Chinese Emission Allowance (CEA), Korean Allowance Unit (KAU) and the New Zealand Units (NZU).
Data Collection
North American carbon markets’ data collection is from 9 a.m. to 5:15 p.m. Eastern Time. Global voluntary carbon markets trade across multiple time zones, and data collection is reflective of all regional operations for the business day. Deals and other trade information received inside of those hours are reviewed and evaluated for consideration in our full-day ranges. In order to meet publication deadlines, OPIS does not accept deals as part of assessment ranges if that information is received by OPIS after 5:15 p.m. Eastern Time.
OPIS Europe Carbon Markets data collection takes place from 9:00 to 17:15 U.K.-time. Deals and other trade information received inside of those hours are reviewed and evaluated for consideration in our full-day ranges. OPIS does not accept deals as part of assessment ranges if that information is received after 17:15 U.K.-time.
Asia Pacific’s data collection is from 9:00 to 16:00 Singapore Time. The Asia Pacific regional carbon markets trade across multiple time zones, and data collection is reflective of respective regional operations for the business day. Deals and other trade information received inside of those hours are reviewed and evaluated for consideration in our full-day ranges. In order to meet publication deadlines, OPIS does not accept deals as part of assessment ranges if that information is received after 16:00 Singapore Time.
Exchange Rates
For Euros to US Dollar conversion, OPIS uses the European Central Bank exchange reference rate.
For British Pound Sterling to US Dollar conversion, OPIS uses the Bank of England exchange rate.
For Australian to US Dollar conversion, OPIS uses the Reserve Bank of Australia exchange rate.
For Korean Won to US Dollar conversion, OPIS uses the Bank of Korea exchange rate.
For New Zealand to US Dollar conversion, OPIS uses the Reserve Bank of New Zealand exchange rate.
For Chinese Yuan to US Dollar conversion, OPIS uses the Bank of China exchange rate.
When a reporting date falls on a public holiday such that exchange rates are not being published, we roll over the latest rate available.
Voluntary Reducing Emissions from Deforestation and Forest Degradation (REDD+) Credits Methodology
OPIS Voluntary REDD+ Credits assessments reflect carbon offset credits certified by Verra (VCS) that include validation under the Climate, Community & Biodiversity Standards (CCB) under VM0004, VM0006, VM0007, VM0009, VM0011, VM0015 methodologies.
OPIS Voluntary REDD+ Credits assessments reflect confirmed bids, offers and trades reported by approved project developers, traders, marketers, brokers and electronic platforms.
Product: REDD+ (VCU + CCB or CCB Gold)
Vintages: OPIS provides vintage-specific assessments beginning with 2017 through the current year and three future years beyond. OPIS also provides a “Retro” assessment that includes vintages 2012 through 2016.
All single vintage assessments will remain active until market fundamentals and feedback support the discontinuation of a stand-alone price assessment. At that time, the vintage will be added to the Retro assessment. Older vintages will remain in Retro until the market has noticeably exhausted the available supply.
OPIS provides vintage averages across tiers, month-to-date average, rolling 30-day average, and rolling-week average Voluntary REDD+ Credits prices.
Voluntary REDD+ Credits Average: OPIS publishes a daily REDD+ credits average price for each of the vintages. The prices reflect an average of the mean price assessment for each REDD+ credit vintage across the volume tiers.
Timing:
Past year and Retro vintages: Any timing, delivery within 12 months
Current year vintage: Any timing, delivery within 24 months
Future year vintages:
Current year+1: Any timing, delivery within 36 months
Current year+2: Any timing, delivery within 48 months
Current year+3: Any timing, delivery within 60 months
Volumes: OPIS assesses three volume tiers.
Tier 1: 350,000+ credits
Tier 2: 50,000 to 349,999 credits
Tier 3: 2,000 to 49,999 credits
Daily Pricing Mechanism: US$/metric ton
Pricing received in non-US$ currencies will be converted to the US Dollar.
For Euros to US Dollar conversion, OPIS uses the European Central Bank exchange reference rate.
For British Pound Sterling to US Dollar conversion, OPIS uses the Bank of England exchange rate.
Afforestation/Reforestation Credits (ARR) Methodology
OPIS ARR Credits assessments reflect carbon credits for the afforestation, reforestation, or revegetation of lands, except wetlands, that include at least one associated co-benefit.
Eligible credits are issued to A/R or ARR climate projects certified under methodologies hosted by established registries, such as the American Carbon Registry, Climate Action Reserve, Gold Standard and Verra.
To satisfy credit integrity, project methodologies must adhere to the following criteria: additionality, measurement accuracy, permanence, do no net harm, and realistic and credible baselines.
An eligible co-benefit is defined as an additional social, environmental, and economic benefits certification, including, but not limited to, the UN’s Sustainable Development Goals (SDG) and Verra’s Climate Community & Biodiversity standards (CCB).
OPIS ARR Credits assessments reflect confirmed bids, offers and trades reported by approved project developers, traders, marketers, brokers and electronic platforms.
Product: ARR
Vintages: OPIS provides vintage-specific assessments beginning with 2017 through the current year and three future years beyond. OPIS also provides a “Retro” assessment that includes vintages 2012 through 2016.
All single vintage assessments will remain active until market fundamentals and feedback support the discontinuation of a stand-alone price assessment. At that time, the vintage will be added to the Retro assessment. Older vintages will remain in Retro until the market has noticeably exhausted the available supply.
OPIS provides vintage averages across tiers, month-to-date average, rolling 30-day average, and rolling-week average Afforestation/Reforestation Credits prices.
Afforestation/Reforestation Credits Average: OPIS publishes a daily Afforestation/Reforestation credits average price for each of the vintages. The prices reflect an average of the mean price assessment for each ARR credit vintage across the volume tiers.
Timing:
Past year and Retro vintages: Any timing, delivery within 12 months
Current year vintage: Any timing, delivery within 24 months
Future year vintages:
Current year+1: Any timing, delivery within 36 months
Current year+2: Any timing, delivery within 48 months
Current year+3: Any timing, delivery within 60 months
Volumes: OPIS assesses three volume tiers.
Tier 1: 350,000+ credits
Tier 2: 50,000 to 349,999 credits
Tier 3: 2,000 to 49,999 credits
Daily Pricing Mechanism: US$/metric ton
Pricing received in non-US$ currencies will be converted to the US Dollar.
For Euros to US Dollar conversion, OPIS uses the European Central Bank exchange reference rate.
For British Pound Sterling to US Dollar conversion, OPIS uses the Bank of England exchange rate.
Blue Carbon Credits (Blue) Methodology
OPIS Blue Carbon Credits assessments reflect carbon credits issued for the sequestration of carbon in ocean and coastal ecosystems that include at least one associated co-benefit.
Eligible credits are issued to mangroves, tidal marshes and seagrass meadows protection and/or restoration climate projects certified under methodologies hosted by established registries, such as the American Carbon Registry, Climate Action Reserve, Gold Standard and Verra.
To satisfy credit quality and integrity, project methodologies must adhere to the following criteria: additionality, measurement accuracy, permanence, do no net harm, and realistic and credible baselines.
An eligible co-benefit is defined as an additional social, environmental, and economic benefits certification, including, but not limited to, the UN’s Sustainable Development Goals (SDG) and Verra’s Climate Community & Biodiversity standards (CCB).
OPIS Blue Carbon assessments reflect confirmed bids, offers and trades reported by approved project developers, traders, marketers, brokers and electronic platforms.
Product: Blue
Vintages: OPIS provides vintage-specific assessments beginning with 2017 through the current year and three future years beyond. OPIS also provides a “Retro” assessment that includes vintages 2012 through 2016.
All single vintage assessments will remain active until market fundamentals and feedback support the discontinuation of a stand-alone price assessment. At that time, the vintage will be added to the Retro assessment. Older vintages will remain in Retro until the market has noticeably exhausted the available supply.
OPIS provides vintage averages across tiers, month-to-date average, rolling 30-day average, and rolling-week average Blue Carbon Credits prices.
Blue Carbon Credits Average: OPIS publishes a daily Blue Carbon credits average price for each of the vintages. The prices reflect an average of the mean price assessment for each Blue credit vintage across the volume tiers.
Timing:
Past year and Retro vintages: Any timing, delivery within 12 months
Current year vintage: Any timing, delivery within 24 months
Future year vintages:
Current year+1: Any timing, delivery within 36 months
Current year+2: Any timing, delivery within 48 months
Current year+3: Any timing, delivery within 60 months
Volumes: OPIS assesses three volume tiers.
Tier 1: 350,000+ credits
Tier 2: 50,000 to 349,999 credits
Tier 3: 2,000 to 49,999 credits
Daily Pricing Mechanism: US$/metric ton
Pricing received in non-US$ currencies will be converted to the US Dollar.
For Euros to US Dollar conversion, OPIS uses the European Central Bank exchange reference rate.
For British Pound Sterling to US Dollar conversion, OPIS uses the Bank of England exchange rate.
Co-benefits Standards Methodology
Climate, Community and Biodiversity Standards
The OPIS CCB and CCB Gold assessments reflect the co-benefits price premiums for Verified Carbon Units (VCUs) that are labeled with Verra’s Climate, Community & Biodiversity Standards Program.
The CCB standard is achieved by satisfying the program’s 17 required co-benefits criteria.
The CCB Gold standard is achieved by satisfying the program’s 17 required co-benefits criteria and at least one optional Gold Level criterion.
Products: CCB, CCB Gold
Timing: Prompt
Daily Pricing Mechanism: US$/metric ton
Sustainable Development Verified Impact Standard (SD VISta)
The OPIS SD VISta assessment reflects the co-benefit price premium for Verified Carbon Units (VCUs) issued to projects that have achieved all 17 of the United Nations Sustainable Development Goals (SDGs) under Verra’s Sustainable Development Verified Impact Standard.
Product: SD VISta
Timing: Prompt
Daily Pricing Mechanism: US$/metric ton
CORSIA Eligible Offsets (CEO) Methodology
OPIS CEO assessments reflect carbon offset credits eligible under the International Civil Aviation Organization (ICAO) Carbon Offsetting and Reduction Scheme for International Aviation (CORSIA) program and are inclusive of ICAO Council approved methodologies for emission units verified by American Carbon Registry (ACR ERTs), China GHG Voluntary Emissions Reduction Program (CCERs), Clean Development Mechanism (CDM CERs), Climate Action Reserve (CRTs), The Gold Standard (VERs), Verra/Verified Carbon Standard (VCUs), and Architecture for REDD+ Transactions (ART TREES). OPIS provides month-to-date average and rolling-week average CEO prices.
OPIS CEO assessments reflect confirmed bids, offers and trades reported by approved project developers, traders, marketers, brokers and electronic platforms.
Product: CEO
Timing: Any timing, delivery within 12 months
Minimum Volume: 1,000 emission offset credits
Daily Pricing Mechanism: US$/metric ton
Pricing received in non-US$ currencies will be converted to the US Dollar.
Core Carbon Credits (CCP) Methodology
The OPIS CCP assessment includes CORSIA-eligible credits, REDD+ credits, as well as other agriculture, forestry, and land use (AFLOU) credits to provide a single price reflective of standard trading across the voluntary carbon market. The OPIS CCP serves as an underlier to the OPIS Carbon Neutral Fuels Index.
Product: CCP
Timing: Any timing, delivery within 12 months
Vintages: Vintage 2016 to previous calendar year vintage
Minimum Volume: 1,000 credits
Daily Pricing Mechanism: US$/metric ton
Carbon Neutral Fuels Index (CNFI) Methodology
OPIS provides daily prices for the estimated cost to offset fossil fuels’ combustion emissions to zero through the retirement of voluntary carbon credits.
Products:
CNFI Aviation Gasoline
CNFI Biodiesel 100%
CNFI Biodiesel HVO 100%
CNFI Butane
CNFI Diesel No 2
CNFI Ethane
CNFI Ethanol
CNFI Gas Oil
CNFI Gasoline
CNFI Heavy Fuel Oil
CNFI Jet Fuel
CNFI Kerosene
CNFI Light Fuel Oil
CNFI Naphtha
CNFI Propane
CNFI IMO Diesel/Gas Oil
CNFI IMO Ethanol
CNFI IMO Heavy Fuel Oil
CNFI IMO Light Fuel Oil
CNFI IMO LNG
CNFI IMO LPG Butane
CNFI IMO LPG Propane
CNFI IMO Methanol
CNFI Compressed Natural Gas
CNFI LNG
CNFI Natural Gas
Timing: Current day pricing based on the OPIS CCP assessment
Daily Pricing Mechanisms: $US/Gal, $US/Bbl, $US/MT, $US/MMBtu, $US/DGE, $US/MCF, and $US/Therm
Calculation: The OPIS Carbon Neutral Fuels Index prices are derived using the daily OPIS Core Carbon Credits (CCP) assessment and the carbon dioxide equivalent (CO2e) emissions factors for 18 standard liquids and gaseous fuels, as well as eight fuels specific to the International Maritime Organization’s (IMO) regulations. The OPIS CNFI prices are calculated using the following formula: CNFI Price = CCP x CO2e of fuel.
Carbon Dioxide Emissions Equivalent Factors for OPIS CNFI products:
| Product | Co2e mt/Gal | Co2e mt/Bbl | Co2e mt/MT | ||||||
| CNFI Aviation Gasoline | 0.00882 | 0.37044 | 3.193 | ||||||
| CNFI Biodiesel 100 | 0.00893 | 0.37506 | 2.650 | ||||||
| CNFI Biodiesel HVO 100 | 0.00920 | 0.38640 | 3.120 | ||||||
| CNFI Butane | 0.00670 | 0.28135 | 3.033 | ||||||
| CNFI Diesel No 2 | 0.01024 | 0.43008 | 3.204 | ||||||
| CNFI Ethane | 0.00407 | 0.17076 | 3.005 | ||||||
| CNFI Ethanol | 0.00571 | 0.23987 | 1.913 | ||||||
| CNFI Gas Oil | 0.01044 | 0.43848 | 3.230 | ||||||
| CNFI Gasoline | 0.00881 | 0.37002 | 3.082 | ||||||
| CNFI Heavy Fuel Oil | 0.01202 | 0.50484 | 3.229 | ||||||
| CNFI Jet Fuel | 0.00963 | 0.40446 | 3.181 | ||||||
| CNFI Kerosene | 0.00962 | 0.40404 | 3.165 | ||||||
| CNFI Light Fuel Oil | 0.01120 | 0.47030 | 3.151 | ||||||
| CNFI Naphtha | 0.00802 | 0.33684 | 3.143 | ||||||
| CNFI Propane | 0.00575 | 0.24177 | 2.998 | ||||||
| CNFI IMO Diesel/Gas Oil | — | — | 3.206 | ||||||
| CNFI IMO Ethanol | — | — | 1.913 | ||||||
| CNFI IMO Heavy Fuel Oil | — | — | 3.114 | ||||||
| CNFI IMO Light Fuel Oil | — | — | 3.151 | ||||||
| CNFI IMO LNG | — | — | 2.750 | ||||||
| CNFI IMO LPG Butane | — | — | 3.030 | ||||||
| CNFI IMO LPG Propane | — | — | 3.000 | ||||||
| CNFI IMO Methanol | — | — | 1.375 | ||||||
| Product | Co2e mt/MMBtu | Co2e mt/DGE | Co2e mt/MT | ||||||
| CNFI Compressed Natural Gas | 0.05520 | 0.00733 | 2.538 | ||||||
| CNFI LNG | 0.05520 | 0.00756 | 2.750 | ||||||
| Product | Co2e mt/MMBtu | Co2e mt/MCF | Co2e mt/Therm | Co2e mt/MT | |||||
| CNFI Natural Gas | 0.05520 | 0.05724 | 0.00552 | 2.538 | |||||
*Source: OPIS derived the C02e factors from: IMO Maritime Environmental Protection Committee Resolution 308, UK Government GHG Conversion Factors, and the U.S. Environmental Protection Agency (EPA) GHG Emission Factors.
California Carbon Allowances (CCA) Methodology
OPIS California Carbon Allowances (CCA) assessments reflect allowances issued for compliance with the state’s and Quebec’s Cap-and-Trade programs. OPIS provides rolling-week average CCA prices and weighted-average prices for prompt and forward Current Year Vintage CCA.
OPIS CCA assessments reflect confirmed bids, offers and trades reported by approved traders, brokers and electronic platforms.
Products:
Current Year Vintage CCA
Previous Year Vintage CCA
Next Year Vintage CCA
Forward Year Vintage CCA
Advance Year vintage CCA
Timing: Prompt and Forward for all five products, in addition to Prompt +1 and Prompt +2 timing for the Current Year Vintage CCA.
Prompt: CCAs delivering prompt month.
Prompt +1: CCAs delivering one month ahead of the prompt month.
Prompt +2: CCAs delivering two months ahead of the prompt month.
Forward: CCAs delivering December of current year.
OPIS provides a daily weighted average price for CCA Current Year Prompt and CCA Current Year Forward.
Roll dates for CCAs with delivery timings of prompt, prompt +1 and prompt +2 are typically scheduled two days before the last business day of the month. Occasionally, the roll date may deviate from this standard due to an OPIS publish or market-observed holiday. In these cases, OPIS will notify subscribers by publishing notices in the Carbon Market Report ahead of the effected roll date.
Due to OPIS’s extensive forward pricing index for the Current Year Vintage CCA market, when October becomes prompt timing, OPIS will advance the Current Year CCA Forward timing to December of the next year. When December becomes prompt timing for the Previous, Next, Forward and Advance Year CCA vintages, OPIS will advance the Forward timing to December of the next year.
Minimum volume: 10,000 allowances.
Daily Pricing Mechanism: US$/metric ton.
California Carbon Offsets (CCO) Methodology
OPIS California Carbon Offsets (CCO) and Direct Environmental Benefit in the State Offsets (DEBS CCO) assessments reflect offsets issued by California’s Air Resources Board for the state’s Cap-and-Trade Program. OPIS provides rolling-week average and month-to-date average CCO prices.
OPIS CCO and DEBS CCO assessments reflect confirmed bids, offers and trades reported by approved traders, brokers and electronic platforms.
Products:
Golden CCO (meets CARB validation criteria, cannot be made invalid.)
CCO 3 (must maintain CARB validation criteria for three consecutive years.)
CCO 8 (must maintain CARB validation criteria for eight consecutive years.)
DEBS Golden CCO (meets CARB validation criteria, cannot be made invalid.)
DEBS CCO 3 (must maintain CARB validation criteria for three consecutive years.)
DEBS CCO 8 (must maintain CARB validation criteria for eight consecutive years.)
Timing: Current calendar year
The assessment will include deals reported by market participants for offsets delivered by the end of the calendar year, until the last month of the year when deals for the following year may also be considered.
Minimum volume: 1,000 allowances.
Daily Pricing Mechanism: US$/metric ton.
Zero California Carbon Offsets (Zero CCO) Methodology
OPIS Zero CCO assessments reflect offsets eligible for California’s Cap-and-Trade Program, with zero invalidation risk due to the optional delivery of eligible California Carbon Allowances (CCA) as an alternative. OPIS provides rolling-week average and month-to-date average Zero CCO prices.
OPIS Zero CCO assessments reflect confirmed bids, offers and trades reported by approved traders, brokers and electronic platforms.
Product: Zero CCO (CCO must meet CARB validation criteria and be considered Golden when delivered, the validation period must end before the last day of the delivery timing. Alternatively, a CCA with a vintage of the delivery timing year or previous may be delivered.)
Timing:
Prompt: Physical delivery in current month of current year.
Forward: Physical delivery December of current year.
Forward+1: Physical delivery December of next year.
Forward+2: Physical delivery December two years out.
Roll dates for Zero CCO December timings typically are scheduled two days before the last business day of the calendar year. Occasionally, the roll date may deviate from this standard due to an OPIS publish or market-observed holiday. In these cases, OPIS will notify subscribers by publishing notices in the Carbon Market Report ahead of the roll date.
Minimum volume: 10,000 allowances
Daily Pricing Mechanism: US$/metric ton
Regional Greenhouse Gas Initiative (RGGI) Allowances Methodology
OPIS RGGI allowances assessments reflect allowances eligible for the Regional Greenhouse Gas Initiative. OPIS provides weighted-average RGGI prices.
OPIS RGGI assessments reflect confirmed bids, offers and trades reported by approved traders, brokers and electronic platforms.
Products: Combined Current Year Vintage and Previous Year Vintage RGGI
Timing: Prompt and Forward
Prompt: RGGIs delivering prompt month.
Forward: RGGIs delivering December of current year.
Prompt roll dates are typically scheduled two days before the last business day of the month. Occasionally, the roll date may deviate from this standard due to an OPIS publish or market-observed holiday. In these cases, OPIS will notify subscribers by publishing notices in the Carbon Market Report ahead of the affected roll date. When December becomes prompt timing the Forward timing rolls to December of the next year.
Minimum volume: 5,000 allowances.
Daily Pricing Mechanism: US$/short ton.
California Cap-at-the-Rack (CAR) Methodology
OPIS California CAR prices reflect the estimated impact of cap-and-trade regulations on gasoline and diesel fuel delivered at each California rack. California’s cap-and-trade regulations officially impact the California rack market beginning January 1, 2015; OPIS began publishing the CAR price August 1, 2014, ahead of the regulation compliance start date.
Products:
CARB RFG Gasoline: Unleaded, Midgrade and Premium
CARB Distillates ULSD: No. 2
B5 Biodiesel
LPG
LNG
Timing: Current day pricing based on the OPIS CCA Current Year Vintage prompt timing assessment. OPIS also provides a week average and a 30-day average for CAR assessment prices.
Daily Pricing Mechanism: Cents-per-gallon; LNG CAR prices are cents-per diesel gallon equivalent (DGE)
Calculation: OPIS uses its assessment for California Carbon Allowances (CCA) to calculate a daily cents-per-gallon cap-at-the-rack value based on the following carbon dioxide equivalent (CO2e) emissions for obligated fuels delivered at California racks:
Carbon Emissions Equivalent Calculations per Gallon for Gasoline & Ethanol
| Summer CARBOB | Winter CARBOB | Ethanol | ULSD No.2 | Biodiesel | LPG | LNG/DGE |
|---|---|---|---|---|---|---|
| Reg 0.00893 | Reg 0.00891 | 0.00022 | 0.01024 | 0.00001 | 0.00582 | 0.00732 |
| Mid 0.00891 | Mid 0.00891 | |||||
| Prem 0.00890 | Prem 0.00892 |
*Source: California Air Resources Board
The LNG CO2e/DGE value of 0.00732 is defined by the following equations:
LNG CO2e/MMBtu = 0.053072
LNG MMBtu/DGE = 7.25 DGE
LNG CO2e/DGE = 0.053072 ÷ 7.25
LNG CO2e/DGE = 0.00732
The OPIS Cap-at-the Rack (CAR) cents-per-gallon assessment for each product is calculated using the following formula: CPG = OPIS daily current year, prompt month CCA assessment mean $/mt x CO2e/gal of obligated fuel.
Since biomass derived fuels have a compliance obligation under the California cap-and-trade program, OPIS considers the CO2e/gal values for those products when calculating the CAR price for blended gasoline and biodiesel delivered at the rack.
The assessment for CAR gasoline prices (CARB RFG) = 90% gasoline grade’s CO2e/gal x the prompt CCA assessment + 10% ethanol CO2e/gal x the prompt CCA assessment.
The assessment for CAR biodiesel prices (B5) = 95% CARB diesel CO2e/gal x the prompt CCA assessment + 5% biodiesel CO2e/gal x the prompt CCA assessment.
CAR Gasoline RVP schedule: The schedule for determining winter or summer blend gasoline CAR calculations at each rack terminal will be determined by the following RVP cap limits and dates set for each air basin in California’s Reformulated Gasoline Regulations. OPIS reserves the right to publish seasonal CAR gasoline prices at each terminal, reflecting vapor pressure specifications based on actual supply availability, which can fluctuate during transition months, apart from the air district’s mandated RVP date.
| Air Basin | Summer | Winter* |
|---|---|---|
| Mojave Desert | March 1 | November 1 |
| North Coast | May 1 | October 1 |
| Sacramento Valley | April 1 | November 1 |
| Salton Sea | March 1 | November 1 |
| San Diego | March 1 | November 1 |
| San Francisco Bay | April 1 | November 1 |
| San Joaquin Valley | April 1 | November 1 |
| South Central Coast | May 1 | November 1 |
| South Coast | March 1 | November 1 |
Twice a year during the RVP transition periods, OPIS will publish a CAR price assessment for both winter and summer gasoline grades in the Carbon Market Report. Both gasoline seasonal CAR price assessments will be published September 28, 29 or 30-October 31 and February 27, 28 or 29-April 30.
Quebec Cap-at-the-Rack Assessment (CAR) Methodology
OPIS Quebec CAR prices reflect the estimated impact of cap-and-trade regulations on fuels distributed in Quebec.
Products:
Gasoline: 87 Unleaded, 89 Midgrade and 91 Premium
Diesel Fuel: High Sulfur #2, Ultra Low Sulfur #2, Ultra Low Sulfur Winter #2, Ultra Low Sulfur #1
Light Oils: High Sulfur Furnace Fuel Oil, Low Sulfur Stove Oil #1, Ultra Low Sulfur Furnace Oil
Biodiesels: *See Below
Timing: Current day pricing, based on the OPIS CCA Current Year Vintage, prompt timing assessment.
Daily Pricing Mechanism: Canada cents-per-liter and U.S. cents-per-gallon.
Currency Conversion: OPIS will reference the Bank of Canada USD-CAD Exchange Rate in its daily price conversions.
Calculation: OPIS will use its assessment for Carbon Allowances (CCA) to calculate a daily Canadian cents-per-liter (cts/L) and U.S. cents-per-gallon (cts/gal) cap-at-the-rack value based on the following carbon dioxide equivalent (CO2e) emissions for obligated fuels supplied in Quebec:
Quebec Fuels Carbon Emissions Equivalent Calculations:
| Gasoline CO2e per Liter | Gasoline CO2e per Gal |
|---|---|
| 87 Reg 0.00236 | 87 Regr 0.00894 |
| 89 Mid 0.00236 | 89 Mid 0.00894 |
| 91 Prem 0.00236 | 91 Prem 0.00894 |
| Diesel Fuels CO2e per Liter | Diesel Fuels CO2e per Gal |
| HS #2 0.00301 | HS #2 0.01138 |
| ULS #2 0.00301 | ULS #2 0.01138 |
| ULS #2 Winter 0.00301 | ULS #2 Winter 0.01138 |
| ULS #1 0.00301 | ULS #1 0.01138 |
| Light Oil CO2e per Liter | Light Oil CO2e per Gal |
| HS Furnace Fuel Oil #2 0.00274 | HS Furnace Fuel Oil #2 0.01035 |
| LS Stove Oil #1 0.00274 | LS Stove Oil #1 0.01035 |
| ULS Furnace Oil 0.00274 | ULS Furnace Oil 0.01035 |
*Source: Quebec’s Ministry of Sustainable Development, Environment and the Fight against Climate Change
The OPIS Cap-at-the-Rack (CAR) Canadian cts/L and U.S. cts/gal for each product are calculated using the following formulas:
CAR cts/L = OPIS daily current year, prompt month CCA assessment mean CAN $/mt x CO2e/L of obligated fuel x 100.
CAR cts/ gal = OPIS daily current year, prompt month CCA assessment mean US $/mt x CO2e/gal x 100.
*Biomass derived fuels do not have a compliance obligation under the Quebec cap-and-trade program, but OPIS considers the CO2e/L and CO2e/gal values for the diesel fuel percentages of biodiesel blends calculating the CAR price for delivered biodiesel fuels.
California Static Carbon Emissions (STAC) Methodology
OPIS California STAC prices reflect the estimated impact of cap-and-trade regulations on static emissions in California’s refining sector.
Products: Refinery
Timing: Current day pricing based on the OPIS CCA Current Year Vintage prompt timing assessment. OPIS also provides a week average and a 30-day average for STAC assessment prices.
Daily Pricing Mechanism: Cents-per-gallon (diesel/gasoline)
Calculation: OPIS uses its assessment for California Carbon Allowances (CCA) to calculate a daily cents-per-fuel-gallon STAC value based on an OPIS derived carbon dioxide equivalent (CO2e) for emissions in each industrial sector.
STAC Refinery cts/gal = (OPIS prompt CCA Current Year Vintage x Refinery CO2e Value) x 100
Refinery CO2e Value Calculation: Most recent annual petroleum refinery emissions reported by the California Air Resources Board (CARB) minus the most recent sector allocations reported by CARB, adjusted to exclude non-refining entities, divided by California refinery taxable fuel sales for gasoline and adjusted for diesel fuel, reported by the California Department of Tax and Fee Administration (CDTFA) during the refinery emissions reporting year. STAC CO2e values will be evaluated and recalculated at the beginning of each calendar year.
For 2024, the refinery STAC CO2e value per fuel gallon will be 0.00060 mt, based on the following data:
2022 CARB reported covered refinery emissions, adjusted for the sector’s 2024 allocations, and excluding estimated compliance obligations and allocations for non-refining entities: 8,782,769 mt
2022 CDTFA reported taxable fuel (gasoline and diesel) sales, adjusted to exclude estimated non-refiner entities: 14,694,130,172 gallons
Refinery Co2e mt/gal: 8,782,769 mt ÷ 14,694,130,172 gal = 0.00060
Washington Carbon Allowances (WCA) Methodology
OPIS Washington Carbon Allowances (WCA) assessments reflect allowances issued for compliance with the state’s Cap-and-Invest program. OPIS provides rolling-month average WCA prices and weighted-average prices for prompt and forward Current Year Vintage WCA.
OPIS WCA assessments reflect confirmed bids, offers and trades reported by approved traders, brokers and electronic platforms.
Products: Current Year Vintage WCA
Timing: Prompt and Forward
Prompt: WCAs delivering prompt month.
Forward: WCAs delivering December of current year.
Roll dates for prompt timing WCA assessments are typically scheduled two days before the last business day of the month. Occasionally, the roll date may deviate from this standard due to an OPIS publish or market-observed holiday. In these cases, OPIS will notify subscribers by publishing notices in the Carbon Market Report ahead of the effected roll date. When December becomes prompt timing, the forward year timing will roll to December next year.
Minimum volume: 10,000 allowances.
Daily Pricing Mechanism: US$/metric ton.
Washington Cap-at-the-Rack (CAR) Methodology
OPIS Washington CAR prices reflect the estimated impact of Cap-and-Invest regulations on gasoline and diesel fuel delivered at each Washington rack.
Products:
CBOB 10% Ethanol: Unleaded, Midgrade and Premium
Conventional Gasoline: Regular Unleaded, Midgrade and Premium
ULSD: No. 2 and No. 1
B5 Biodiesel
Propane
Timing: Current day pricing bases on the OPIS WCA Current Year Vintage prompt timing assessment. OPIS also provides a week average and a 30-day average for CAR assessment prices.
Daily Pricing Mechanism: Cents-per-gallon
Calculation: OPIS uses its assessment for Washington Carbon Allowances (WCA) to calculate a daily cents-per-gallon cap-at-the-rack value based on the following carbon dioxide equivalent (CO2e) emissions for obligated fuels delivered at Washington racks:
Carbon Emissions Equivalent Calculations per Gallon for Gasoline & Ethanol
| Summer CBOB/Conv. | Winter CBOB/Conv. | Ethanol | ULSD No.1 | ULSD No.2 | Biodiesel | Propane |
| Reg 0.00909 | Reg 0.00888 | 0.00003 | 0.01016 | 0.01024 | 0.00001 | 0.00576 |
| Mid 0.00910 | Mid 0.00893 | |||||
| Prem 0.00911 | Prem 0.00898 |
While OPIS calculates Cap-at-the Rack prices for various fuel types, an assessment price does not imply a compliance obligation for every fuel type or use, which is determined according to the Washington Department of Ecology’s guidelines.
Exempt fuels under Washington’s Cap and Invest program include:
Further guidance can be found at https://ecology.wa.gov/Air-Climate/Climate-Commitment-Act/Cap-and-invest/Emissions-reporting
*Source: Washington Department of Ecology
The OPIS Cap-at-the-Rack (CAR) cents-per-gallon assessment for each product is calculated using the following formula: CPG = OPIS daily current year, prompt month WCA assessment mean $/mt x CO2e/gal of obligated fuel.
Since biomass derived fuels have a compliance obligation under the Washington Cap-and-Invest program, OPIS considers the CO2e/gal values for those products when calculating the CAR price for blended gasoline and biodiesel delivered at the rack.
The assessment for CAR gasoline prices (CBOB 10% ethanol) = 90% gasoline grade’s CO2e/gal x the prompt WCA assessment + 10% ethanol CO2e/gal x the prompt WCA Assessment.
The assessment for CAR biodiesel prices (B5) = 95% ULSD No.2 CO2e/gal x the prompt WCA assessment + 5% biodiesel CO2e/gal x the prompt WCA Assessment.
Renewable Energy Certificate (REC) Methodology
OPIS provides daily price discovery for Renewable Energy Certificates (RECs) generated for one megawatt-hour (MWh) of renewable electricity under Renewable Portfolio Standard (RPS) programs in several jurisdictions in the Pennsylvania, New Jersey, Maryland Power Pool (PJM) and the New England Power Pool (NEPOOL).
Products:
PJM Tri-Qualified
New Jersey Class I
New Jersey Solar (SREC)
Maryland Tier I
Maryland Solar (SREC)
Pennsylvania Tier I
Pennsylvania Solar (SREC)
NEPOOL Dual Qualified
Connecticut Class I
Massachusetts Class I
Massachusetts- SREC I
Massachusetts SREC II
Delivery: any timing, physical for the named vintage year
Roll Dates: OPIS assesses two vintage years for each product. For PJM credits, timing rolls the day after the RPS compliance report deadline for the named year in each individual jurisdiction.
For NEPOOL credits, the current year timing rolls the day after the final transfer date allowable in the NEPOOL-GIS system ahead of the RPS compliance report deadline for the named year in each individual jurisdiction.
OPIS reserves the right to roll coverage forward to the more liquid vintage in cases where trade liquidity shifts prior to the stated roll date.
Individual Roll Dates are as follows:
PJM Tri-Qualified: December 1
New Jersey Class I: December 1
New Jersey Solar (SREC): December 1
Maryland Tier I: April 1
Maryland Solar (SREC): April 1
Pennsylvania Tier I: September 1
Pennsylvania Solar (SREC): September 1
NEPOOL Dual Qualified: June 16
Connecticut Class I: June 16
Massachusetts Class I: June 16
Massachusetts- SREC I: June 16
Massachusetts SREC II: June 16
Minimum volume:
PJM Tri-Qualified, Pennsylvania Tier I, New Jersey Class I, Maryland Tier 1: 1,000 RECs;
NEPOOL Dual Qualified, Massachusetts Class I, Connecticut Class I: 500 RECs
Pennsylvania SREC, New Jersey SREC, Maryland SREC, Massachusetts SRECs I and II: 10 RECs
Daily Pricing Mechanism: $/MWh
European Union Allowances (EUA) Methodology
OPIS provides daily price discovery for European Union Allowances (EUAs) created for the cap-and-trade EU Emissions Trading System (EU ETS) that are being traded in the marketplace and sold in auctions.
Product: EUA
Timing: Prompt, Forward and Forward +1
Prompt: EUAs delivering prompt month
Forward: EUAs delivering December of current year
Forward +1: EUAs delivering December of next year
The roll date for EUA prices with prompt delivery timing is typically the last Tuesday of the calendar month except for when the last Tuesday follows a U.K. public holiday or when there is a U.K. public holiday in the three days after the last Tuesday of the month, in which case the roll date would be the prior Tuesday. Occasionally, the roll date may deviate from this standard due to an OPIS publish or market-observed holiday. In these cases, OPIS will notify subscribers by publishing notices in the Carbon Market Report ahead of the affected roll date.
OPIS will advance EUA prices in the Forward and Forward +1 timings to December of the next year when the current year December market rolls to prompt timing.
Minimum volume: 25,000 allowances
Daily Pricing Mechanism: €/mt
United Kingdom Allowances (UKA) Methodology
OPIS provides daily price discovery for United Kingdom Allowances (UKAs) created for the cap-and-trade United Kingdom’s Emissions Trading System (UK ETS) that are being traded in the marketplace and sold in auctions.
Product: UKA
Timing: Forward
Forward: UKAs delivering December of current year.
The forward roll date for UKA prices is typically the last Tuesday of December except for when the last Tuesday falls on a U.K. public holiday or when there is a U.K. public holiday in the three days after the last Tuesday of the month, in which case the roll date would be the prior Tuesday. Occasionally, the roll date may deviate from this standard due to an OPIS publish or market-observed holiday. In these cases, OPIS will notify subscribers by publishing notices in the Carbon Market Report ahead of the affected roll date.
Minimum volume: 5,000 allowances
Daily Pricing Mechanism: £/mt
Australian Carbon Credit Units (ACCU) Methodology
OPIS ACCU assessments reflect tradable carbon offset credits generated from emission reduction projects registered with Australia’s Emission Reduction Fund (ERF) using approved methodologies. An ACCU is a unit issued by the Clean Energy Regulator to a person who is an account holder of the Australian National Registry of Emissions Units. Each ACCU issued represents one metric ton of carbon dioxide equivalent (mtCO2e) stored or avoided.
OPIS ACCU Generic reflects credits generated from avoidance-based projects that include landfill gas and alternative waste management and avoided deforestation projects.
OPIS ACCU Generic (No AD) reflects credits generated from avoidance-based projects that include landfill gas and alternative waste management and excludes avoided deforestation projects.
OPIS ACCU HIR (Human-Induced Regeneration) reflects credits generated from projects adopting the human-induced regeneration of a permanent even-aged native forest methodology which stores carbon by regenerating native forest on eligible land through activities such as livestock and grazing management. The HIR method expired on September 30, 2023, but projects that started their crediting period before the expiry are unaffected.
OPIS ACCU SFM (Savanna Fire Management) reflects credits generated from avoidance-based projects that reduce the emission of greenhouse gasses from fire in savannas in northern Australia through a reduction in the frequency and extent of late dry season fires. Indigenous co-benefits (ICB) reflect the additional environmental, economic, social, and cultural benefits that a project brings to the indigenous communities.
OPIS ACCU EP (Environmental Planting) reflects credits generated from projects that establish and maintain vegetation such as trees or shrubs on land that has been cleared of forest for at least five years. Such projects are subject to a permanence obligation of 25 or 100 years.
OPIS ACCU assessments reflect confirmed bids, offers, and trades reported by approved project developers, traders, marketers, brokers, and electronic platforms.
Products:
ACCU Generic
ACCU Generic (No AD)
ACCU HIR
ACCU SFM with ICB
ACCU SFM w/o ICB
ACCU EP
Timing: Prompt, delivery within four business days.
Minimum Volume: 5,000 units
Daily Pricing Mechanism: AUD/mtCO2e, USD/mtCO2e
New Zealand Unit (NZU) Methodology
OPIS New Zealand Unit (NZU) assessments reflect tradable emission units issued by the government through free allocation or at auction to participants of the New Zealand Emission Trading Scheme (ETS). NZUs can be emission permits issued to covered industrial entities or carbon credits issued to post-1989 forestry activities and other eligible removal activities. Each NZU represents one metric ton of carbon dioxide equivalent (mtCO2e of emissions).
OPIS NZU assessments reflect confirmed bids, offers, and trades reported by approved traders, brokers, and electronic platforms.
Product: NZU
Timing: Prompt, delivery within four business days
Minimum Volume: 5,000 units
Daily Pricing Mechanism: NZD/mtCO2e, USD/mtCO2e
Korean Allowance Unit (KAU) Methodology
OPIS Korean Allowance Unit (KAU) assessments reflect emissions permits issued to liable entities for compliance with South Korea’s Emissions Trading Scheme (ETS). Each KAU represents one metric ton of carbon dioxide equivalent (mtCO2e) of emissions.
OPIS KAU assessments reflect confirmed bids, offers, and trades reported by approved traders, brokers, and electronic platforms.
Product: KAU
Vintage: Current compliance year vintage. The product vintage will roll to the next compliance year vintage on the first business day of September. For example, during the calendar year 2024, the price assessment will represent a KAU23, and the product vintage will roll to KAU24 on the first business day of September 2024.
Timing: Prompt, delivery within four business days
Minimum Volume: 1,000 units
Daily Pricing Mechanism: Korean Won/mtCO2e, USD/mtCO2e
Korean Offset Credit (KOC) Methodology
OPIS Korean Offset Credit (KOC) assessments reflect voluntary offset credits generated from greenhouse gas reductions issued by domestic and international projects that are eligible for compliance with South Korea’s Emissions Trading System. Each KOC represents one metric ton of carbon dioxide equivalent (mtCO2e) of emission.
KOCs are assigned vintages based on the year of issuance and are valid for five years, expiring at the end of the last calendar year of the five-year period. OPIS KOC assessment includes all vintages eligible for compliance with South Korea’s ETS program and reflects the most competitive bids, offers and trades reported by approved traders, brokers and electronic platforms.
Product: KOC
Timing: Prompt, delivery within four business days
Minimum volume: 1,000 credits
Vintages: All vintages eligible for South Korea ETS compliance prior to expiry
Daily Pricing Mechanism: Korean Won/mtCO2e, USD/mtCO2e
Low Carbon Fuel Standard Credits (LCFS) and Clean Fuel Program Credits (CFP) are located in the OPIS Renewables Fuels Methodology.
U.S. Gulf Coast
Minimum volumes are indicated for each product below. In some instances of low liquidity, lower-volume transactions might be included in the daily price assessment if all other standard transaction criteria are met.
U.S. Atlantic Coast
Minimum volumes are indicated for each product below. In some instances of low liquidity, lower-volume transactions might be included in the daily price assessment if all other standard transaction criteria are met.
U.S. Midwest
Minimum volumes are indicated for each product below. In some instances of low liquidity, lower-volume transactions might be included in the daily price assessment if all other standard transaction criteria are met.
U.S. West Coast
Minimum volumes are indicated for each product below. In some instances of low liquidity, lower-volume transactions or those with slight specification variation might be included in the daily price assessment if all other standard transaction criteria are met.
OPIS’s California LCFS Carbon Intensity Calculations
OPIS in 2016 revised its calculation of the dollar value per carbon intensity point ($/CI) and carbon credit value per gallon (CPG) and has since 2011 reported a CI level for its spot ethanol pricing in Los Angeles and San Francisco and published a carbon credit value per gallon of gasoline and diesel calculation.
The formulae for those calculations are as follows:
The price per CI point, in dollar terms ($/CI point per gallon): OPIS Carbon Credit value x CARB Denatured Ethanol Energy Density/1,000,000 (normalizing factor) = $/CI per gallon.
The Carbon credit value Per Gallon (CPG) value of gasoline and diesel carbon credits: CPG = OPIS Carbon Credit value x (Current CI of CARBOB or CARB Diesel – Target CI of CARBOB or CARB Diesel) x Energy Density of CARBOB or CARB diesel x 10^-6.
OPIS in April 2020 began publishing additional LCFS values to reflect an increase in the average carbon intensity (CI) of crude oil supplied to California refineries, which was approved in December 2019 by CARB. CARB’s action effectively raised the 2020 baseline CI values for gasoline and diesel under the LCFS program by 0.23 gCO2e/MJ. For the 2024 compliance year, the incremental deficit addition was set at 1.18 gCO2e/MJ.
OPIS publishes the cost of the incremental deficit in carbon credit value per gallon (CPG) for gasoline and diesel based on its daily assessment of LCFS credit values as well as a value that combines the cost of complying with the LCFS program and the cost of the incremental deficit, for both CARBOB gasoline and CARB diesel.
The formulae used to arrive at them are as follows:
Carbon CPG Gasoline/Diesel Crude CI Deficit: OPIS Carbon Credit value x 1.18 x Energy Density of CARBOB or CARB diesel x 10^-6
Carbon CPG Gasoline/Diesel Combined LCFS/Crude CI Deficit: (OPIS Carbon Credit value x 1.18 x Energy Density of CARBOB or CARB diesel x 10^-6) + (OPIS Carbon Credit value x (Current CI of CARBOB or CARB Diesel – Target CI of CARBOB or CARB Diesel) x Energy Density of CARBOB or CARB diesel x 10^-6)
The underlying CI scores of the formulae above (the Current CI and Target CI) and the pathway calculations for CI are subject to change at CARB’s discretion and in accordance with the LCFS regulatory timetable.
| As of Jan. 1, 2024 | |
| CARBOB CI | 100.82 |
| Gasoline Target CI | 87.01 |
| Diesel Current CI | 100.45 |
| Diesel Target CI | 87.89 |
Further, OPIS publishes an additional assessment of CPG values based on the carbon intensity of E10 blended gasoline and B5 blended diesel. The formulae for those calculations will be as follows:
Carbon Gasoline 90% CPG = OPIS Carbon Credit value x (Current CI of CARBOB – Target CI of CARBOB) x Energy Density of CARBOB x 10^-6 x 0.90.
Carbon Diesel 95% CPG = OPIS Carbon Credit value x (Current CI of CARB Diesel – Target CI of CARB Diesel) x Energy Density CARB diesel x 10^-6 x 0.95.
Energy Densities of LCFS Fuels and Blendstocks*
| Fuel (units) | Energy Density |
| CARBOB (gal) | 119.53 (MJ/gal) |
| CaRFG (gal) | 115.83 (MJ/gal) |
| Diesel fuel (gal) | 134.47 (MJ/gal) |
| CNG (therm) | 105.5 (MJ/therm) |
| LNG (gal) | 78.83 (MJ/gal) |
| Electricity (KWh) | 3.60 (MJ/KWh) |
| Hydrogen (kg) | 120.00 (MJ/kg) |
| Denatured Ethanol (gal) | 81.51 (MJ/gal) |
| FAME biodiesel (gal) | 126.13 (MJ/gal) |
| Renewable Diesel (gal) | 129.65 (MJ/gal) |
| Alternative Jet Fuel (gal) | 126.37 (MJ/gal) |
| Propane (LPG) (gal) | 89.63 (MJ/gal) |
*Source: California Air Resources Board
OPIS’s Oregon CFP Carbon Intensity Calculations
As it does for the LCFS program, OPIS calculates a dollar per CI and carbon credit value per gallon of gasoline and diesel calculation under Oregon’s Clean Fuels Program.
The formulae for those calculations are as follows:
The price per CI point, in dollar terms ($/CI point per gallon): OPIS Carbon Credit value x DEQ Denatured Ethanol Energy Density/1,000,000 (normalizing factor) = $/CI per gallon.
The Carbon credit value Per Gallon (CPG) value of gasoline and diesel carbon credits: CPG = OPIS Carbon Credit value x (Current CI of DEQ Gasoline or Diesel – Target CI of DEQ Gasoline or Diesel) x Energy Density of Gasoline and Diesel x 10^-6.
The underlying CI scores of the formulae above (the Current CI and Target CI) and the pathway calculations for CI are subject to change at DEQ’s discretion and in accordance with the CFP regulatory timetable.
| As of Jan. 1, 2024 | |
| Gasoline Current CI | 100.14 |
| Gasoline Target CI | 90.21 |
| Diesel Current CI | 100.74 |
| Diesel Target CI | 90.84 |
Further, OPIS publishes an assessment of CPG values based on the carbon intensity of E10 blended gasoline and B5 blended diesel. The formulae for those calculations follow:
Carbon Gasoline 90% CPG = OPIS Carbon Credit value x (Current CI of DEQ Gasoline – Target CI of DEQ Gasoline) x Energy Density of Gasoline x 10^-6 x 0.90.
Carbon Diesel 95% CPG = OPIS Carbon Credit value x (Current CI of DEQ Diesel – Target CI of DEQ Diesel) x Energy Density diesel x 10^-6 x 0.95.
Energy Densities of CFP Fuels and Blendstocks*
| Fuel (units) | Energy Density |
| Gasoline (gal) | 122.48 (MJ/gal) |
| Diesel fuel (gal) | 134.48 (MJ/gal) |
| CNG (therm) | 105.5 (MJ/therm) |
| LNG (gal) | 78.83 (MJ/gal) |
| Electricity (KWh) | 3.60 (MJ/KWh) |
| Hydrogen (kg) | 120.00 (MJ/kg) |
| Denatured Ethanol (gal) | 81.51 (MJ/gal) |
| Clear Biodiesel (gal) | 126.13 (MJ/gal) |
| Renewable Hydrocarbon Diesel (gal) | 129.65 (MJ/gal) |
| Undenatured Anhydrous Ethanol | 80.53 (MJ/gal) |
*Source: Oregon Department of Environmental Quality
OPIS’s Washington Clean Fuel Standard Carbon Intensity Calculations
As it does for the LCFS and CFP programs, OPIS calculates a dollar per CI and carbon credit value per gallon of gasoline and diesel calculation under Washington’s Clean Fuel Standard.
The formulae for those calculations are as follows:
The price per CI point, in dollar terms ($/CI point per gallon): OPIS Carbon Credit value x CFS Denatured Ethanol Energy Density/1,000,000 (normalizing factor) = $/CI per gallon.
The Carbon credit value Per Gallon (CPG) value of gasoline and diesel carbon credits: CPG = OPIS Carbon Credit value x (Current CI of CFS Gasoline or Diesel – Target CI of CFS Gasoline or Diesel) x Energy Density of Gasoline and Diesel x 10^-6.
The underlying CI scores of the formulae above (the Current CI and Target CI) and the pathway calculations for CI are subject to change at the Washington Department of Ecology’s discretion and in accordance with the CFS regulatory timetable.
| As of Jan. 1, 2024 | |
| Gasoline Current CI | 100.46 |
| Gasoline Target CI | 97.97 |
| Diesel Current CI | 101.18 |
| Diesel Target CI | 99.11 |
Further, OPIS publishes an assessment of CPG values based on the carbon intensity of E10 blended gasoline and B5 blended diesel. The formulae for those calculations follow:
Carbon Gasoline 90% CPG = OPIS Carbon Credit value x (Current CI of CFS Gasoline – Target CI of CFS Gasoline) x Energy Density of Gasoline x 10^-6 x 0.90.
Carbon Diesel 95% CPG = OPIS Carbon Credit value x (Current CI of CFS Diesel – Target CI of CFS Diesel) x Energy Density diesel x 10^-6 x 0.95.
Energy Densities of CFS Fuels and Blendstocks*
| Fuel (units) | Energy Density |
| Gasoline (gal) | 122.48 (MJ/gal) |
| Diesel fuel (gal) | 134.48 (MJ/gal) |
| CNG (therm) | 105.5 (MJ/therm) |
| LNG (gal) | 78.83 (MJ/gal) |
| Electricity (KWh) | 3.60 (MJ/KWh) |
| Hydrogen (kg) | 120.00 (MJ/kg) |
| Denatured Ethanol (gal) | 81.51 (MJ/gal) |
| Clear Biodiesel (gal) | 126.13 (MJ/gal) |
| Renewable Hydrocarbon Diesel (gal) | 129.65 (MJ/gal) |
| Undenatured Anhydrous Ethanol | 80.53 (MJ/gal) |
*Source: Washington Department of Ecology
Dallas
Minimum volumes are indicated for each product below. In some instances of low liquidity, lower-volume transactions might be included in the daily price assessment if all other standard transaction criteria are met.
Tampa
Minimum volumes are indicated for each product below. In some instances of low liquidity, lower-volume transactions might be included in the daily price assessment if all other standard transaction criteria are met.
Brazil
Minimum volumes are indicated for each product below. In some instances of low liquidity, lower-volume transactions might be included in the daily price assessment if all other standard transaction criteria are met.
OPIS gives the greatest weight in its daily assessment process to confirmed deals, followed by bids and offers.
Minimum volumes are indicated for each product below. In some instances of low liquidity, lower-volume transactions might be included in the daily price assessment if all other standard transaction criteria are met.
Ethanol RIN Credits
This is the price assessment range for Renewable Identification Numbers (RINs) attached to Renewable Biofuel as defined under the U.S. EPA’s Renewable Fuel Standard (RFS) and designated by the agency as D6 RINs. Trades are generally for a minimum of 500,000 RINs. RINs are generated by production of ethanol or other specified renewable fuels and traded daily for delivery anywhere in the U.S. Smaller or larger volume RIN trades as well as confirmed bids and offers may also be used in factoring the daily RIN price assessment. Ethanol RIN credit values are shown for the current and previous years of trading.
Biodiesel RIN Credits
This is the price assessment range for RIN credits attached to Biomass-based Diesel as defined under the RFS and designated by EPA as D4 credits. RINs are generated by production of biomass-based biodiesel and traded daily for delivery anywhere in the U.S. generally for a minimum of 250,000 RINs. Smaller volume RIN trades as well as confirmed bids and offers may also be used in factoring the daily RIN price assessment. Biodiesel RIN credit values are shown for the current year and previous years.
Cellulosic Ethanol RIN Credits
This is the spot price assessment range for RINs attached to Cellulosic Biofuel and designated as D3 RINs under the RFS. Values are shown for the current and previous trading years. Trades will generally be for a minimum of 100,000 RINs, though smaller volume trades, as well as confirmed bids and offers may be used in determining a price assessment.
Advanced Biofuel Credits
This is the price assessment range RIN credits attached to Advanced Biofuels and designated as D5 RINs under the RFS for a minimum of 100,000 RINs for the current year and the previous years. Smaller volume Advanced Biofuels RIN trades as well as confirmed bids and offers may also be used in factoring the daily RIN price assessment.
In addition to showing current-year and prior-year RIN values, OPIS will, typically in the fourth-quarter of each year, begin showing following-year RIN values as they become available.
Renewable Volume Obligation
The OPIS Renewable Volume Obligation (RVO) calculation provides an assessment of the daily cost of complying with the Renewable Fuel Standard (RFS) in cts/gal. OPIS determines the RVO by taking the sum of the daily average prices for current-year Renewable Identification Number (RIN) credits for each of the D categories and multiplying them by EPA’s annual RVO percentages, adjusted for nested RIN values. OPIS publishes an RVO cents per gallon value for current-year timing as well as a month-to-date average.
| Percentage Standards | 2024 |
| Renewable fuel | 12.5% |
| Advanced biofuel D5 | 3.79% |
| Biomass-based diesel D4 | 2.82% |
| Cellulosic biofuel D3 | 0.63% |
Price Exclusions
OPIS editors have the discretion to exclude values that represent extraordinary circumstances or are far outside the range of other values reported on a given day. Editors reserve the right to exclude any deal or deals they deem to be “not reflective” of the prevailing fair market value.
Price Discovery
OPIS collects over 250 posted prices every Monday through Friday. These postings are gathered from over 20 different companies in the U.S. including the major refiners. Every month, more than 50 refiners and exploration companies use our reports to benchmark their crude transactions. OPIS also collects the gravity scales and the gravity API reported by each company.
Data Integrity
Data accuracy is verified each day by hand as well as by a system of programs that audit the data for abnormalities. Every month OPIS compares each individual field against summary documents provided by the posting companies to provide the most accurate service available.
Time Stamp
OPIS offers either an evening update published approximately after 6:00pm ET, for the most current information available, or a more comprehensive morning update published after 11:30am ET. In addition to the daily updates, OPIS also offers a monthly EDQ average file delivered on the 3rd business day of the month. The EDQ file contains the previous months monthly average of each crude posting collected.
Note: Because of the sometimes thin nature of feedstocks trading, OPIS ranges for various products may sometimes encompass a relatively wide range of specifications. Editors are instructed to exclude bbls which are deemed “off spec” from particular price ranges, but sometimes we are not privy to a long list of specifications for individual cargo and barge loads.
While every effort is made to include completed transactions within price range assessments, because of illiquidity, the assessments are sometimes subjective and based on a reasonable judgment as to where buyers and sellers would meet on common ground.
What follows is an approximation of “ballpark” specifications for feedstocks covered in daily OPIS Overnight publication.
Specifications
Vacuum Gasoil
Price ranges for low sulfur VGO reflect material with a 0.6% sulfur content or less. Other typical specs would be: API Gravity of 22 min/30 max.; 110 degree F. max. Pour; CCR of 0.5% max.; Metals (ppm): Vanadium 1.5 max., Sodium 2.0 max., Iron 2.0 max., Copper 1.0 max, Nickel 1.0 max.; Aniline, 180 F. min.; Flash Point, 150 F. min.; Nitrogen, (wt %), 1,300 max.; Distillation, 425 F. IBP min., 1,100 F. FBP max.
Medium sulfur VGO would typically reflect 0.7-1.4% sulfur max. material; API Gravity, 22 min/30 max.; 110 F. max Pour; CCR, 0.5% max. Metals (ppm): Vanadium 1.5% max., Sodium 2.0 max., Iron 20 max., Copper 1.0 max, Nickel 1.0 max.; Aniline, 170 F. min.; Flash Point, 150 F. min.; Nitrogen (WT%), 1,500 max.; Distillation, 425 F. IBP min., 1,100 F. FBP max.
High sulfur VGO is typically 1.5% sulfur or higher; API Gravity, 22 min./30 max.; 110 F. max. Pour; CCR, 0.5% max.; Metals (ppm): Vanadium 1.5 max., Sodium 2.0 max., Iron 2.0 max., Copper 1.0 max., Nickel 1.0 max.; Aniline, 160 F. min.; Flash Point, 150 F. Min., Nitrogen (WT%), 1,500 max.; Distillation, 425 F. IBP min., 1,100 F. FBP max.
While VGO volumes transacted in the USGC spot market are not expected to exactly match the VGO specifications listed above, the above specifications serve as a benchmark for making spot assessments. VGO with materially above-average qualities (relative to the above specifications) would be expected to command a stronger price, and VGO with materially sub-par specifications would be expected to be discounted for quality.
Depending on the extent of the quality discrepancy from the specifications listed above, OPIS may decide to reflect VGO deals somewhere within price ranges (near one end of the range rather than the mean), or OPIS may decide that the qualities of the VGO in question are too far removed from the above specifications to be considered representative of spot VGO values.
VGO cargo price assessments reflect minimum 200,000 bbl parcels, delivered ex-duty basis to Gulf Coast ports. VGO barge price assessments typically represent domestic transactions for barges of 40,000 bbl or more on a delivered Houston basis, although smaller volumes (minimum 20,000 bbl) and volumes for delivery to other Gulf Coast locations will be considered as well.
Timing on VGO cargoes: VGO cargoes typically trade one to two weeks before the cargoes land in the U.S. Gulf Coast. If a trade involves a cargo landing sooner than one week out, OPIS will attempt to determine if the material was discounted for prompt delivery and will consider the transaction level in that context. Some cargo trades involve material arriving more than two weeks out, and OPIS will consider such cargoes in its forward pricing assessments.
Timing on VGO barges: VGO barge trades typically involve delivery within five days. If a barge trade involves delivery within two days, OPIS will attempt to determine if the material received a discount or a premium for prompt delivery and will consider the transaction level in that context. OPIS also will consider barge transactions for delivery more than five days out for purposes of general price discovery.
Guidelines for Establishing VGO Ranges
The Gulf Coast VGO spot market on some days can be fairly illiquid (i.e. few if any spot VGO deals confirmed). Following are OPIS guidelines for establishing VGO ranges when the market is illiquid.
Case No. 1: Two or more VGO deals
If two or more VGO deals are reported and confirmed, then it is fairly easy to establish the VGO range. For example, if barge HSVGO trades at $7.50/bbl, $8.00/bbl and $8.25/bbl over September WTI, then the barge HSVGO range for the day would be $7.50-$8.25/bbl over September WTI.
Case No. 2: One VGO deal
If only one VGO deal is reported and confirmed, the most common practice is to establish a $0.50/bbl range that encompasses the reported transaction level as the mean.
For example, if barge LSVGO trades at $9.00/bbl over September WTI, a barge LSVGO range of $8.75-$9.25/bbl over September WTI would be warranted. This makes September WTI plus $9.00/bbl the mean value and also indicates a reasonable bid/ask range.
Case No. 3: No deals, only offers
If no deals are confirmed but offer levels are confirmed, it should be remembered that sellers can offer VGO at any level that they want, but that does not necessarily mean that buyers would be willing to bid anywhere near the offer level.
Offer levels are most meaningful when they are lower than the prior day’s assessment, since that means that even sellers view the market as weaker than the day before. For example, if barge HSVGO was assessed the day before at $7.50-$8.25/bbl over September WTI and a seller today is offering barge HSVGO at $8.00/bbl over September WTI, establishing a barge HSVGO range of $7.50-$8.00/bbl over September WTI would be warranted (in the absence of confirmed deals or bid levels).
In the event of two sellers coming from two different offer levels – say, $7.75/bbl and $8.00/bbl over September WTI – a range of $7.50-$8.00/bbl over September WTI would still be warranted since not all sellers are willing to sell at $7.75/bbl over September WTI.
Note: The low end of the barge HSVGO assessment is $7.50/bbl over September WTI because buyers in most cases can be expected to be coming from at least $0.25/bbl under the weakest offer level (in this case, $7.75/bbl over September WTI). In the event of a single offer level confirmed (say, $8.00/bbl over September WTI), it would not be unreasonable to expect buyers to be coming from $0.50/bbl under the offer level, which would also result in a barge HSVGO assessment of $7.50-$8.00/bbl over September WTI.
Case No. 4: No deals, only bids
If no deals are confirmed but bid levels are confirmed, it should be remember that buyers can bid for VGO at any level that they want, but that does not necessarily mean that sellers would be willing to sell anywhere near the bid level.
Bid levels are most meaningful when they are higher than the prior day’s assessment, since that means that even buyers view the market as stronger than the day before.
For example, if barge HSVGO was assessed the day before at $7.50-$8.25/bbl over September WTI and a potential buyer today is bidding for barge HSVGO at $7.75/bbl over September WTI, establishing a barge HSVGO range of $7.75-$8.25/bbl over September WTI would be warranted (in the absence of confirmed deals or offer levels).
In the event of two buyers coming from two different bid levels – say, $7.75/bbl and $8.00/bbl over September WTI – a range of $7.75-$8.25/bbl over September WTI would still be warranted since not all buyers are willing to buy at $8.00/bbl over September WTI.
Note: The high end of the barge HSVGO assessment is $8.25/bbl over September WTI because sellers in most cases can be expected to be coming from at least $0.25/bbl over the strongest bid level (in this case, $8.00/bbl over September WTI ). In the event of only a single bid level confirmed (say, $7.75/bbl over September WTI), it would not be unreasonable to expect sellers to be coming from $0.50/bbl over the bid level, which also would result in a barge HSVGO assessment of $7.75-$8.25/bbl over September WTI.
Case No. 5: No deals, only bids and offers
Changing a VGO assessment based only on bids and offers is easiest when buyers and sellers are either raising their bids and offers by roughly the same amount or lowering their bids and offers by roughly the same amount. This is because, as mentioned previously, buyers can bid at any level that they want, and sellers can offer at any level that they want. Buyers coming from lower bids levels and sellers coming from higher offer levels might not provide sufficient justification for changing the day’s VGO assessment.
On the other hand, if buyers are coming from stronger bid levels and sellers are coming from weaker offer levels, that could be justification for narrowing the day’s VGO assessment (say, from $8.00-$9.00/bbl over September WTI the day before to $8.25-$8.75/bbl over September WTI today if bids have been confirmed at $8.25/bbl over September WTI and offers have been confirmed at $8.75/bbl over September WTI).
Example: Say the prior day’s VGO assessment was $8.00-$9.00/bbl over September WTI and sellers today are coming from $8.50/bbl over September WTI and bids have been confirmed at $7.00/bbl over September WTI. The most prudent move would be to move the range downward by $0.50/bbl (to $7.50-$8.50/bbl over September WTI) since 1) offer levels are $0.50/bbl lower than the high end of the prior day’s range and 2) as mentioned before, potential buyers can bid at any level that they want, so just because they are bidding $1.00/bbl lower than the low end of the prior day’s range does not mean that sellers would entertain selling at or near that level.
Maintaining LSVGO/MSVGO/HSVGO Spreads and Barge/Cargo Spreads
OPIS has six separate U.S. Gulf Coast VGO assessments: Cargo LSVGO, Cargo MSVGO, Cargo HSVGO, Barge LSVGO, Barge MSVGO and Barge HSVGO.
Even on days when spot VGO deals are reported, it is unlikely that trades will be reported for all six categories.
Maintaining LSVGO/MSVGO/HSVGO Spreads
In the absence of market information indicating otherwise, if a LSVGO deal is reported but no MSVGO or HSVGO deals are reported, the prior day’s LSVGO/MSVGO/HSVGO spreads should be maintained. That is, if a barge LSVGO trade indicates that the barge LSVGO assessment versus WTI should be raised by $0.25/bbl, then barge MSVGO and HSVGO assessments versus WTI should also be raised by $0.25/bbl. However, should market sources indicate that barge HSVGO is offered at a weaker level versus WTI than the day before (despite barge LSVGO trading at a stronger level), then the barge LSVGO/HSVGO spread should be changed accordingly.
Maintaining Barge/Cargo Spreads
Similarly, in the absence of market information indicating otherwise, if a barge deal is reported but no cargo deals are reported, the prior day’s barge/cargo spreads should be maintained. That is, if a barge LSVGO trade indicates that the barge LSVGO assessment versus WTI should be raised by $0.25/bbl, then the cargo LSVGO assessment versus WTI should also be raised by $0.25/bbl. However, should market sources indicate that cargo LSVGO is offered at a weaker level versus WTI than the day before (despite barge LSVGO trading at a stronger level), then the barge/cargo LSVGO spread should be changed accordingly.
Forward VGO Assessments
OPIS’s forward VGO assessments on the U.S. Gulf Coast utilize the out-month West Texas Intermediate (WTI) crude contract along with forward (also referred to as “ratable”) USGC unleaded and ultra-low-sulfur diesel (ULSD) values to calculate a forward USGC 70/30 split.
OPIS Gulf Coast refined products coverage tracks a ratable-timing range. Ratable numbers are an average of a full month of Colonial Pipeline cycles. Because this range tracks a full month, during the first cycle of each month, the ratable range reflects the same month. When the second cycle of the month becomes prompt, the ratable timing switches to the next month.
VGO Assessments versus the U.S. Gulf Coast 70/30 split
VGO values in the U.S. Gulf Coast spot market are typically discussed as differentials to West Texas Intermediate (WTI) crude, and those assessments are a key part of the OPIS International Feedstocks Intelligence (OPIS IFI) Report.
The OPIS IFI Report also includes VGO assessments versus the U.S. Gulf Coast 70/30 split (both the split based on Ultra-Low-Sulfur Diesel and the split based on High Sulfur No. 2 Oil).
It should be noted that daily VGO assessments versus the USGC 70/30 split are typically calculated based on where VGO was assessed versus WTI crude. It should also be noted that VGO assessments versus the USGC 70/30 split are rounded in the OPIS IFI Report to the nearest 0.00 or 0.05ct/gal (see below).
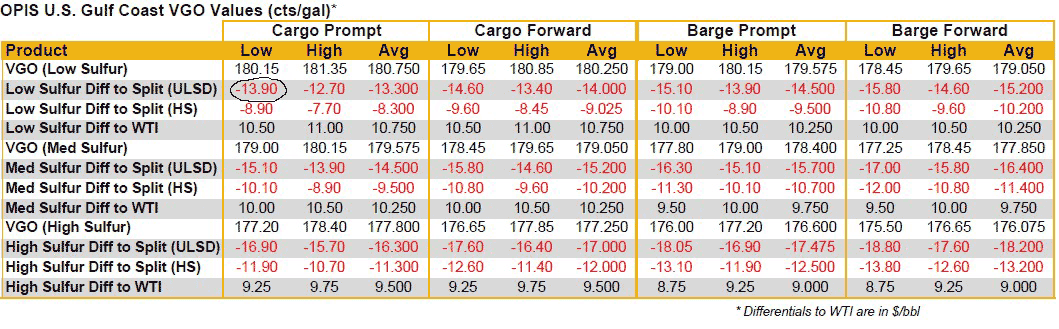
Naphtha
Domestic 40N+A (Heavy) Naphtha:
Values for domestic 40 N+A heavy naphtha reflect material with 38-44 N+A, an initial boiling point of 150-160 Degrees F., an end point of 350-380 Degrees F., +20 minimum color, a maximum RVP of 4.0 lbs., 3 parts per million maximum nitrogen, 500 parts per million maximum sulfur, and an API gravity of 56-60.
Domestic Full-Range Naphtha:
Values for domestic full-range naphtha reflect material with 36-40 N+A, an initial boiling point of 100-120 Degrees F., a 10% distillation of 130-160 Degrees F., an end point of 350-380 Degrees F., +20 minimum color, an RVP of 4.5-6.5 lbs., 3 parts per million maximum nitrogen, 500 parts per million maximum sulfur, and an API gravity of 60-64.
Offshore Naphtha:
Offshore 40 N+A naphtha assessments tend to reflect offshore naphtha grades with high N+A content (44-48) but with full-range qualities such as an initial boiling point of 100-120 Degrees F., an RVP of 4.5 lbs. or higher, and an API of 60 or higher.
Domestic 40N+A heavy naphtha, domestic full-range naphtha and offshore naphtha are all assessed as differentials (cts/gal) to USGC waterborne unleaded.
In the absence of reported spot market activity, domestic full-range naphtha and offshore naphtha typically are assessed as differentials to domestic 40N+A heavy naphtha, and the resulting values are shown as differentials to USGC waterborne unleaded.
Paraffinic Naphtha
Assessment is typically reflective of material with the following specifications: 65 minimum paraffin content, 84 maximum API gravity, 500 ppm maximum sulfur, 13.0-lb. maximum RVP, 50 ppm maximum oxygenates, 50 ppb maximum lead, 10 ppb maximum arsenic, 5 ppb maximum mercury, 1 ppm maximum H2S in liquid, and +20 minimum Saybolt color.
Assessments reflect 50,000-bbl barge volumes delivered on the U.S. Gulf Coast within 5 days from date of publication.
Sour paraffinic naphtha is assessed as a differential to OPIS Mt. Belvieu non-TET natural gasoline and is reported in dollars per metric ton.
Straight Run Residual Fuel
Prices for Gulf Coast low sulfur straight run residual fuel tend to reflect transactions, delivered into the Gulf Coast inside duty, for 0.5% material and similar grades out of NW Europe. Other low sulfur grades may from time to time be included when made available to Gulf Coast buyers.
On days when no low sulfur straight run (LSSR) deals are reported, it is common for LSSR to be discussed and assessed at a discount ($/bbl) to U.S. Gulf Coast low sulfur VGO. However, LSSR’s value is shown as an absolute price ($/bbl) and as a differential to WTI crude ($/bbl).
High sulfur straight run values at the Gulf Coast typically reflect delivered Gulf Coast values for M-100, or E-4 material, but may often include high sulfur straight run from domestic sources and various material from offshore sources such as the Mediterranean.
High sulfur straight run (HSSR) typically is discussed and assessed as a differential to Brent crude. However, HSSR’s value is shown as an absolute price ($/bbl) and as a differential to WTI crude ($/bbl).
Light Cycle Oil
OPIS assessments for light cycle oil generally reflect material with 1.2% to 1.8% sulfur. Gravity is generally 14-17 API, and cetane is typically within a range of 20-25. The upper limit for color is 2.5, and the end point is no higher than 690-700 degrees Fahrenheit. Some higher-sulfur grades of LCO command similar prices as 1.2-1.8% sulfur material, and trade of those grades may be reflected in OPIS assessments from time to time. OPIS assessments for low sulfur light cycle oil reflect material with a maximum sulfur content of 0.5%. Other quality specifications affecting the value of a spot LCO volume may be taken into consideration, such as haze, and if some of these specifications are not within the parameters of what most traders consider typical, and if a volume traded at a discount for that reason, OPIS will take this into account when establishing ranges. OPIS LCO assessments reflect the delivered value at various Gulf Coast locations.
Light Cycle Oil is assessed as a differential (cts/gal) to U.S. Gulf Coast high sulfur No. 2 oil.
West Coast Intermediate Feedstocks – Vacuum Gasoil and Cycle Oil
OPIS shows West Coast VGO values in three ways: as absolute prices (cts/gal); as differentials to the Los Angeles 70/30 split (70% of the price of Los Angeles regular unleaded gasoline and 30% of the price of Los Angeles ultra-low-sulfur diesel); and as differentials to WTI and ANS crude oil.
West Coast VGO values tend to be discussed in the market as differentials to the Los Angeles 70/30 split, and absolute values and differentials to crude are usually derived from VGO differentials to the split.
The West Coast VGO spot market is not a highly liquid market. In the absence of reported spot transactions, OPIS assesses West Coast low sulfur and high sulfur VGO as differentials to the Los Angeles 70/30 split and carries those differentials over from day to day unless market information indicates that those differentials have changed.
Price ranges for low sulfur VGO reflect 0.0-0.3% sulfur material. Other typical specs: API gravity 19-25; CCR 0.5% max; all Metals less than 1 ppm; Sodium less than 1 ppm; Aniline typically 165-185 F.; Nitrogen (WT%) ranges 1,000-1,500 ppm.
High sulfur VGO can range between 0.3-1.5% sulfur material, but the most typical sulfur spec would range from 1.0-1.5%. Other “typical” specs would include: API gravity 19-25; CCR 0.5% max; all Metals less than 1 ppm; Sodium less than 1 ppm; Aniline typically 150-175 F.; Nitrogen (WT%) less than 3,000 ppm.
Light Cycle Oil material has a maximum sulfur content of 0.5%, with a typical Viscosity of 2.5-3.5. Lower viscosity material is generally discounted. Gravity is usually 13-19.
Light Cycle Oil typically is assessed as a percentage of the price of Los Angeles ultra-low-sulfur diesel (ULSD).
OPIS will consider deals involving VGO or cycle oil with non-typical specs. However, in such cases, OPIS also will take into consideration whether the material garnered a premium for above-average specs or a discount for sub-standard specs, and spot assessments will be made accordingly.
OPIS will consider for assessment purposes spot transactions involving delivery or loading in the current month or in the immediate forward month. While price assessments reflect delivered values, deals transacted on an fob basis also can serve as market indicators, with a delivered equivalent value extrapolated from freight costs.
| LSVGO | HSVGO | Light Cycle Oil | |
| Sulfur | 0 – 0.3% | 0.3 – 1.5% | 0.5% Max |
| API Gravity | 19 – 25 | 19 – 25 | 13 – 19 |
| CCR | 0.5% Max | 0.5% Max | |
| Metal | < 1 PPM | < 1 PPM | |
| Sodium | < 1 PPM | < 1 PPM | |
| Aniline | 165 – 185 F | 150 – 175 F | |
| Nitrogen | 1,000 – 1,500 PPM | < 3,000 PPM | |
| Viscosity | 2.5 – 3.5 (centistokes at 122 F) |
Note: Higher viscosity is generally discounted based on current market conditions.
Asia Naphtha
The assessments reflect pricing of products for loading 45 to 90 days from the date of publication based on three half-month cycles. In other words, a report for March 1 will reflect reflection of forward prices for H2 Apr (1st cycle), H1 May, (2nd cycle), and H2 May (3rd cycle).
For naphtha we take an average forward value of the 2nd and 3rd cycle to calculate CFR Japan quotes to serve as the benchmark. The trades are based on forward paper deals and bids/offers with a parcel size of 25,000 tonnes. We use the numbers at the close at 4:30 pm Singapore Time to calculate OPIS final signature values.
For FOB Arab Gulf naphtha assessments, we take the OPIS final signature value of CFR Japan quotes and deduct freight differentials for Arab Gulf-Japan cargoes. FOB Singapore quotes are calculated as follows: (1st cycle of OPIS final signature/9) minus freight minus $0.05/bbl (port charge).For the CFR Korea naphtha assessment, it is calculated based on the inter-session rate of change of the CFR Japan quotes, rounded to the nearest 25 cents, or as traded in the market.
Europe Naphtha
The physical flat price assessment is based on public physical spot deals transacted between 4:00-4:30pm London time.
The OPIS CIF NWE Naphtha Settle Price assessment, will bring forward the roll of the reference month swap considered, when the 10-25 days forward delivery period crosses two calendar months.
OPIS will roll the Naphtha CIF NWE reference month swap when eight days of the delivery period fall into the second month. This will change from the existing reference month roll, which takes place on the 25th of each month.
This would affect the settle price for Naphtha CIF NWE, Open-Spec Naphtha and Paraffinic Naphtha.
Physical deals concluded determine the assessed price for the day.
LVN and OSN Differential Assessment Process:
OPIS assesses naphtha physical CIF NWE value-to-market by canvassing the market on a full-day basis for the Open Spec and for Paraffinic grade (LVN) naphtha (basis min 80% paraffins). Once assessed, the differentials are applied to the physical price assessment for the day to arrive at the outright levels for LVN and OSN.
Delivery (time is ET)
6:15 p.m.
OPIS International Feedstocks Intelligence
(Feedstocks deals reported by 5:30 p.m. Eastern will be considered for inclusion in that day’s price assessments.)
8:30 a.m.
OPIS Asia Naphtha & LPG Report
3:30 p.m.
OPIS Europe LPG & Naphtha Report
(effective May 4, 2020)
Specifications
East Coast
0.3% ULSFO: Gravity of min 10.5 to max 24.9 API. Viscosity of max 300 SSF. Pour point of max 110 F. Min of 149,000 BTU/gal. Flash point of min 175. FBS&W of max 1.0%. Sediment of max 0.3%.
0.5% VLSFO: Primarily a marine fuel, specifications may vary slightly due to blending but must contain a maximum of 0.5% sulfur and contain characteristics comparable to IFO fuels and must fall within accepted business standards of marine fuels. The final assessment of 0.5%S will take into account the various blends available.
1.0% SFO: Aluminum+Silicon (Al+Si) content of max 80 ppm. Nitrogen of max 0.5%. Vanadium of max 150 ppm. Gravity of min 10.1 to max 18.0 API. Viscosity of min 70 to max 250 SSF. Flash Point of min 150 F. Pour point of max 60 F. Ash of max 0.1%. BS&W of max 1.0%. Water by distillation of max 1.0%. Sediment by extraction of max 0.1%. Vanadium of max 150 ppm. Sodium of max 60 ppm. Asphaltenes of max 8%. Min of 151,000 BTU/gal, H2S of max 50 ppm.
3.0% HSFO: Gravity of min 10 API. Viscosity of max 300 SSF. Vanadium of max 300 ppm. Al+Si of max 80 ppm. Flash point of min 150 F. BS&W of max 1%. Ash of max 0.1%.
Gulf Coast
0.5% VLSFO: Primarily a marine fuel, specifications may vary slightly due to blending but must contain a maximum of 0.5% sulfur and contain characteristics comparable to IFO fuels and must fall within accepted business standards of marine fuels.
3.0% HSFO: Sulfur of max 3%. Gravity of min 10.2 API. Viscosity of 150-250 SSF. Vanadium of max 450 ppm. Ash of max 0.1%. Flash point of min 150 F. Pour point of max 60 F. Al+Si of max 80 ppm. Compatibility rating of max 2. Water of max 0.5%.
Conversion Rates: OPIS publishes bulk residual fuel oil assessments in US$/barrel and US$/metric ton using the following conversion rates from barrels to metric tons: 0.3% ULSFO 6.84; 0.5% VLSFO 6.702; 1% SFO 6.35; 3% HSFO 6.35.
Assessment Timing: OPIS residual fuel price assessments take into account all transactions throughout the trading day. Trades are weighted toward the close of the day’s trading. A transaction that occurs at 9:00 am EST may be less relevant than a trade that occurs at 5:00 pm EST as fuel oil markets can gain or lose value, but nonetheless does indicate market value. Residual fuel spot trading overviews are also considered as part of the assessment.
Qualifying Transactions: OPIS assesses fuel oil trades delivered from 7-9 days in the U.S. Gulf Coast and 10-15 days in the U.S. East Coast. Prices are published in US$/bbl. Individual local taxes are not considered for assessment.
Priority is given to deals done, with bids and offers also taken into account. In the absence of market positions, fuel oil swaps prices will be considered in making assessments.
Typicals on size:
• U.S. Gulf Coast: 45,000 bbl
• U.S. East Coast: 50,000 bbl
OPIS provides accurate and up-to-date price assessments based on FOB benchmarks that include those out of Singapore, South Korea, Taiwan and the Middle East which are summarized in our daily market reports.
OPIS uses an average of daily forward paper/swaps value as a basis of our Asian daily assessments. We use the numbers at the close at 4:30 pm Singapore Time to calculate OPIS final signature values.
The assessments generally reflect pricing of products loading 15 to 30 days from the date of publication. In other words, a report for March 1 will reflect forward prices from March 16-31.
In our assessments, we use a variety of inputs which include outright, floating as well as a combination of both in terms of daily bids, offers and strike prices in the respective oil product market on both the physical and paper trading.
We calculate the mid-value of 15-30 days forward trading window by using the weighted average calculation that use the curve of 1st and 2nd cycle of swaps value. Then we add a discount or premium to calculate FOB Singapore quotes.
For discount/premium assessments for FOB Singapore quotes, we take transactions with a size of a minimum of 100,000 barrels, maximum 250,000 barrels for jet fuel; a minimum of 150,000 barrels and maximum 250,000 barrels for gasoil. FOB Arab Gulf Jet Fuel and Gasoil assessments are a simple freight netback from FOB Singapore quotes.
FOB Korea Jet Fuel assessment is a simple freight netback from the OPIS USWC Los Angeles Jet Fuel quote and the NYMEX Heating Oil quote (freeze at 4:30pm Singapore time). The calculation for FOB Taiwan Jet Fuel is assessment as follows: (FOB Singapore quotes minus FOB Singapore discount/premium) + discount/premium for the market. Editors confirm and record deals done with a size of 30,000-60,000 tonnes for FOB Taiwan discount/premium assessments.
For instance, if FOB Singapore Jet Fuel quote is $124.56/bbl with a premium of 85-cents/bbl, and if the freight rate for FOB Arab Gulf-Singapore LR 1 is $2.58/bbl, the calculation for FOB AG LR 1 is following: 124.56-2.58=$121.98/bbl. If FOB Taiwan premium is $1.00/bbl for the same day, the calculation for FOB Taiwan Jet Fuel assessment is following: (124.56-0.85)+1.00=$124.71/bbl.
Delivery (times are ET)
8:30 a.m. OPIS Asia Jet Fuel & Gasoil Report
The assessments reflect pricing of products for loading 30 to 75 days from the date of publication based on three half-month cycles. In other words, a report for March 1 will reflect assessments of forward prices for H1 Apr (1st cycle), H2 Apr, (2nd cycle), and H1 May (3rd cycle).
For LPG markets, we take an average forward value of the 1st and 2nd cycle to calculate CFR Japan quotes to serve as the benchmark. The trades are based on forward paper deals and bids/offers for LPG with a parcel size of 22,000 tonnes for LPG (both propane and butane). We use the full-day value of forward papers.
For FOB Arab Gulf LPG assessments, we take Saudi Contract Prices (CP) swaps as a basis and add the discount/premium assessments determined by OPIS. For CFR China LPG assessments, we check the differentials between CFR Japan market by confirming and recording spot deals for cargoes of up to 44,000 tonnes.
For the CFR Korea naphtha assessment, it is calculated based on the inter-session rate of change of the CFR Japan quotes, rounded to the nearest 25 cents, or as traded in the market.
Delivery (times are ET)
8:30 a.m. OPIS Asia Naphtha & LPG Report
OPIS EUROPEAN ASSESSMENTS FOR JET BARGES AND CARGOES, AND MIDDLE DISTILLATE BARGES AND CARGOES
OPIS provides physical spot assessments for jet and middle distillates in northwest Europe (NWE) and the Mediterranean. Prices are reported as a differential to the front-month ICE Low Sulfur Gasoil settlement, and as an outright price. The spot assessments reflect activity from 9:00 a.m. to 4:30 p.m. London Time.
Jet barges are assessed using the OPIS450 methodology.
Other assessments reflect an average of deals or, in the absence of deals, a reflection of value between bids and offers. For jet, diesel and gasoil cargoes, OPIS assesses the value of bids and offers relative to the previous day’s assessed differential to the nearest outright swap value and/or the forward swap curve. Differential values versus Low Sulfur Gasoil futures on the Intercontinental Exchange (ICE) take precedence over floating price indications.
Jet Assessments
OPIS450 Jet FOB FARAG Barge
OPIS assesses 2,000 to 3,000 metric tons (mt), loading in the Flushing, Antwerp, Rotterdam, Amsterdam and Ghent (FARAG) region, 3-11 days forward from the assessment date. Bids must include Rotterdam and one of the other four ports. Sellers can nominate from one to five ports. The assessment reflects jet A1 quality.
The OPIS450 methodology assesses the value of a product over 450 minutes.
OPIS450 pricing takes the Low Sulfur (LS) Gasoil futures settle price on the Intercontinental Exchange (ICE) at 4:30 p.m. London time and adds the average of the differential value for FOB FARAG jet barges valued for each of the 450 minutes between 9:00 a.m. and 4:30 p.m. London time.
Bids, offers and trades throughout the day, expressed as a differential to the front-month LS Gasoil future, are compared to a notional reference differential value (RV). Differentials based on the second month LS Gasoil future will be calculated equivalent to the front month, using the settle prices for the futures on the day. OPIS450 will roll forward to the next month’s LS Gasoil future on the day of the expiry.
The RV is derived from the forward curve of the FOB FARAG jet barge swap at 4:30 p.m. London time, rounded to the nearest 25 cents. The RV will be calculated by using the gradient of the forward curve of the outright FOB FARAG jet barge swap between the balance month and first month, or first month and second month when balance month trade is no longer available or sufficiently liquid, and extrapolated to the day of assessment.
The differential value will change at the minute when there is a trade, or a higher bid or lower offer. Over a day, the first trade, or bid or offer to pass the RV, will set the value for the preceding minute marks as well as the following minute marks, until there is a higher bid or lower offer or trade to set value.
New bids and offers should be placed sequentially, with guidance of $1/mt increments to the current differential value to be considered for assessment. In the event of a cross over between bid and offer, the offer will take precedence.
Data Submission
For bids or offers to be considered in OPIS’s price assessment, traders are recommended to nominate a recognized broker to relay their indications to OPIS editors. Editors will blast the indications, including counterparty name, volume, loading dates, and ports as well as the name of the acting broker and timestamp, to market participants over the OPIS ICE Chat channel. The bid or offer must stay with the nominated broker, and be live and executable in real time. In the event of a trade, standard industry nomination and pricing procedures apply.
Bid and offer values will also appear on the OPIS Jet Ticker page.
OPIS editors will confirm the validity of a bid or offer with the broker at the time of the initial posting by phone, as well as subsequent moves during the day.
In addition, OPIS considers verified bids, offers and trades posted on other trading platforms. For bids and offers posted on an alternative platform, the alternative platform name will be added onto the OPIS ICE Chat channel. A change to the bid or offer on another platform must be relayed in real-time to OPIS.
In the event of a trade on another platform, or the withdrawal of the bid or offer on another platform, the corresponding bid or offer on the OPIS ICE Chat channel is cancelled.
After market close, OPIS editors will review the data submitted and may remove bids, offers or trades that are deemed unrepresentative of market value. OPIS editors may disregard pricing data from a counterparty if they are subject to credit or trading restrictions.
On days when there is no activity, or no trade during the day or bids or offers seen that challenge the RV, the editor will use the RV to set the assessment.
The spreadsheet used for the assessment will be available on request to market participants.
OPIS 450 Jet Market Minimum Contract Terms
The contract for a jet barge trade should adhere to the following minimum contract provisions, developed and developing in consultation with spot market actors.
Please note:
Jet CIF NWE Cargo
OPIS assesses 30,000 mt cargoes, plus or minus 10% (seller’s option), part or full load as the basis for its CIF jet cargo assessments, which are made basis Le Havre and Rotterdam, and arriving 10-25 days forward from the date of assessment and publication. Trades conducted into non-restricted ports in northwest Europe, excluding Scandinavia, may be taken into account. The assessment reflects Jet A1 specification.
Jet FOB Mediterranean Cargo
The FOB Mediterranean Jet cargo price is calculated as a netback of freight costs for a 30,000 mt part cargo between Augusta and Amsterdam. This freight cost is published in the OPIS Europe Jet, Diesel and Gasoil Report.
Diesel Assessments
ULSD FOB ARA Barge
OPIS assesses Ultra Low Sulfur Diesel (ULSD) barges loading 1,000 to 3,000 mt at the ports of Amsterdam, Rotterdam and Antwerp. The assessment window is 3-15 days forward on Monday and Tuesday and 5-15 days forward on Wednesday, Thursday and Friday from the date of publication. This assessment reflects German specification diesel with a maximum sulfur content of 10ppm. The typical density is 0.845 kg/l, with actual density ranging from 0.82 to 0.845 kg/l.
ULSD CIF NWE Cargo
OPIS will assess 30,000 mt cargoes, plus or minus 10% (seller’s option), of French/Benelux specification. The assessment is made basis ports between the Amsterdam, Rotterdam and Antwerp trading hub and Le Havre. Bids, offers and trades should have standard charter party options to include Hamburg to Bordeaux and north Spain, Thames, ports on the east and south coast of the UK. West Coast UK charter party options may not be unreasonably withheld.
ULSD CIF Mediterranean Cargo
OPIS assesses 25,000 to 30,000 mt cargoes of French/Benelux spec specification. The assessment is made basis ports along the stretch of coast that extends between Sete in France and Naples in Italy, as well as Malta. Bids and offers and trades should have standard charter party options, to include Euromed, Not East of But Including Greece (NEOBIG), Turkish Med, Slovenia, Croatia and the Sea of Marmara options.
Gasoil Assessments
Gasoil FOB ARA Barge
OPIS assesses barges loading 1,000 to 3,000 mt at the ports of Amsterdam, Rotterdam and Antwerp. The assessment window is 3-15 days forward on Monday and Tuesday and 5-15 days forward on Wednesday, Thursday and Friday from the date of publication. This assessment reflects heating oil grades with a reference density of 0.845 kg/l and with a maximum sulfur content of 0.1%
Gasoil 50ppm FOB ARA Barge
Gasoil 50ppm FOB ARA Barge is assessed for loading 1,000 to 3,000 mt at the ports of Amsterdam, Rotterdam and Antwerp. The assessment window is 3-15 days forward on Monday and Tuesday and 5-15 days forward on Wednesday, Thursday and Friday from the date of publication. The assessment reflects German specification heating oil with a maximum sulfur content of 50 ppm. The typical density is basis 0.845 kg/l.
Gasoil CIF NWE Cargo
OPIS assesses ports between Hamburg to Le Havre, including the trading hub of Amsterdam, Rotterdam and Antwerp. Bids and offers should have standard charter party options to include German ports, French ports as far south as Bordeaux, North Spain and ports on the east and south coast of the UK. The assessment reflects French FOD and also German DIN gasoil fuel with a maximum sulfur content of 0.1% and normalized to a reference density of 0.845 kg/l. The assessment typically reflects cargoes between 18,000 and 30,000 mt, subject to the vessel being able to discharge at a berth fully laden. The delivery window is 10-25 days forward from the day of assessment.
Gasoil CIF Mediterranean Cargo
OPIS assesses Gasoil CIF Mediterranean Cargo basis ports that cover the stretch of coast between Barcelona and Naples, as well as Malta. The assessment reflects Spanish, French and Italian quality gasoil. The assessment is based on 25,000 to 30,000 metric ton cargoes, subject to the vessel being able to discharge at a berth fully laden. The delivery window is 10-25 days forward from the day of assessment and publication.
Historical and Projected Jet and ULSD Imports into EU
OPIS publishes eight months of historical European Commission data from Global Trade Tracker for jet fuel and ULSD imports. Additionally, data is gathered from external sources and Vortexa to provide an assessment of likely import levels for four current and future months. A dotted line in this chart carries year before European Commission data.
Forward curve
Two months and two quarters of calendar forward prices are provided for barge and cargo jet and other barge-traded products. For these, futures contracts which run from middle of the month are converted into calendar equivalents and added to calendar monthly swaps figures to represent accurately the cost of locking in prices in those months. For forward quarters, individual calendar outright forward prices are calculated and added to produce accurate quarterly forward prices.
Product cracks and rolling Brent
OPIS calculates product cracks to Brent crude, priced at the afternoon (4.30 p.m. London time) marker. To provide a reliable reflection of the relative economics, a rolling assessment is used in the calculation of cracks. This involves reflecting the coming contract price for the following month in increments each day so as to smooth the otherwise step change that occurs at the expiry of the current futures contract.
Carbon and clean prices
OPIS’s clean jet and carbon assessments make use of the settlement price for the relevant carbon contracts. For the purpose of benchmarking jet fuel on a “clean” basis, with associated carbon costs under the European Emissions Trading System included, the carbon price, called EU Allowances, is converted into dollars at settlement time, and multiplied by 3.15 before being added to jet fuel.
Methodology for NW Europe Propane
The focus of our methodology is to:
The OPIS CIF ARA Propane assessment considers cargoes for 10-25 days forward delivery, basis Flushing, and in the volume range of 19,000 – 24,000 metric tons to capture the majority of bids, offers and deals. The grade, quality, delivery and nomination terms remain based on the prevailing industry-accepted forward contract, such as the TOT contract. Positions referencing alternative forward delivery contracts will be considered if the dates fall into the 10-25 day forward delivery range.
Assessments consider physical spot deals and swaps transacted between 4:00pm-4:30pm London time.
Physical bids must have a minimum 5-day delivery date range and offers a maximum 5-day delivery date range entirely within the 10-25 days forward delivery period, basis Flushing.
Deals, bids and offers that carry a minimum 50% fixed price component will be considered for the purpose of price discovery.
A fixed price is a specific price a buyer or seller would pay to secure tons. The remaining floating component refers to swaps, often with a differential.
Deals, bids and offers, which carry additional requirements that may be seen as restrictive, are not considered for pricing assessments.
Physical Spot Price Assessment
OPIS uses the following method to derive physical spot price assessments:
In the cases where there are no deals, OPIS moves the assessed physical-paper differential in line with stronger or weaker spot indications, i.e. higher bids or lower offers relative to the reference month swap level compared to the previous trading day.
Otherwise, OPIS considers the previous day’s differential, market feedback and intelligence gathered by editors, the forward structure and factors affecting the supply-demand balance.
Floating Price Calculation
NWE Butane
Butane prices are for field grade mixed butane cargoes above 4,000 metric tons delivered 10-25 days forward basis CIF ARA.
FOB Med Propane and Butane
In the Mediterranean, OPIS assesses field grade and refinery grade propane and butane FOB basis Lavera 5-15 days forward. The assessment considers cargo sizes of 1,500 metric tons and above.
OPIS editors contact a cross-section of market participants daily. This typically entails the editor communicating with approved sources – via telephone, email or instant messenger – to help determine their spot assessments on the day. Information published is according to the best available data on the day and is subject to change. Please direct any enquiries to energylpedseurope@opisnet.com.
In the event of transparent trading, agreed upon by market participants, outside of the typical 4:00-4:30pm London time bracket (ex: ahead of a public holiday), OPIS will assess the market during this earlier time period. OPIS will include a subscriber note detailing what the new time will be, on an as-needed basis, ahead of the session(s) in question. The timing of earlier trade is typically 12-12:30pm London time.
End-of-Day Swaps Curves
OPIS aggregates close-of-business swap data from broker reports to help make up its End-of-Day NWE Forwards and Global Forward price assessments. Note: Belvieu Global Propane Forward Price assessments are for TET/LST propane. All forward curve information must be received by our editors no later than 7:00pm London time. Editors may exclude data that falls outside what is considered the normal range. Reports received after that time may be evaluated for market perspective but will not be automatically included in the forward market range.
NWE Naphtha Pricing Methodology
The physical flat price assessment is based on public physical spot deals transacted between 4:00-4:30pm London time.
The OPIS CIF NWE Naphtha Settle Price assessment, will bring forward the roll of the reference month swap considered, when the 10-25 days forward delivery period crosses two calendar months.
OPIS will roll the Naphtha CIF NWE reference month swap when eight days of the delivery period fall into the second month. This will change from the existing reference month roll, which takes place on the 25th of each month.
This would affect the settle price for Naphtha CIF NWE, Open-Spec Naphtha and Paraffinic Naphtha
Physical deals concluded determine the assessed price for the day.
LVN and OSN Differential Assessment Process:
OPIS assesses naphtha physical CIF NWE value-to-market by canvassing the market on a full-day basis for the Open Spec and for Paraffinic grade (LVN) naphtha (basis min 80% paraffins). Once assessed, the differentials are applied to the physical price assessment for the day to arrive at the outright levels for LVN and OSN.
Delivery (Eastern Time)
3:30 p.m. OPIS Europe LPG Report
The starting point for the OPIS “SRI” is the average of the prior-day’s closing spot range in each U.S. spot market. Each day OPIS’s editors survey traders and brokers and publish a FULL DAY range that represents their assessment of the value of spot transactions for gasoline and diesel fuel that day. OPIS has mapped many rack markets back to their spot delivery points. From the OPIS Full Day Average Spot Price, OPIS then adds the existing pipeline tariffs based on the distance that product flows in the line from the spot entry point to the rack terminal location. It then adds in line loss due to evaporation in the line, terminaling and storage (transfer) fees if product moves from line to line, an estimated fee for proprietary additives, a cost of money factor, pipeline security charge and trucking fees for applicable markets where product is shipped using vehicles. For distillates, OPIS approximates the cost of various additives (lubricity, red dye, etc.). Today’s SRI shows yesterday’s closing spot price delivered into a specific market.
Each rack that contains an SRI number displays the spot market to which the rack location is mapped.
OPIS developed this methodology after more than a year of discussion with major oil suppliers, marketers and resellers.
Bulk Residual Fuel Oil Spot Pricing
(Effective March 26, 2020)
Specifications
New York Harbor
0.3% ULSFO: Gravity of min 10.5 to max 24.9 API. Viscosity of max 300 SSF. Pour point of max 110 F. Min of 149,000 BTU/gal. Flash point of min 175. FBS&W of max 1.0%. Sediment of max 0.3%.
0.5% VLSFO: Primarily a marine fuel, specifications may vary slightly due to blending but must contain a maximum of 0.5% sulfur and contain characteristics comparable to IFO fuels and must fall within accepted business standards of marine fuels. The final assessment of 0.5%S will take into account the various blends available.
1.0% SFO: Aluminum+Silicon (Al+Si) content of max 80 ppm. Nitrogen of max 0.5%. Vanadium of max 150 ppm. Gravity of min 10.1 to max 18.0 API. Viscosity of min 70 to max 250 SSF. Flash Point of min 150 F. Pour point of max 60 F. Ash of max 0.1%. BS&W of max 1.0%. Water by distillation of max 1.0%. Sediment by extraction of max 0.1%. Vanadium of max 150 ppm. Sodium of max 60 ppm. Asphaltenes of max 8%. Min of 151,000 BTU/gal, H2S of max 50 ppm.
3.0% HSFO: Gravity of min 10 API. Viscosity of max 300 SSF. Vanadium of max 300 ppm. Al+Si of max 80 ppm. Flash point of min 150 F. BS&W of max 1%. Ash of max 0.1%.
Houston
0.5% VLSFO: Primarily a marine fuel, specifications may vary slightly due to blending but must contain a maximum of 0.5% sulfur and contain characteristics comparable to IFO fuels and must fall within accepted business standards of marine fuels.
3.0% HSFO: Sulfur of max 3%. Gravity of min 10.2 API. Viscosity of 150-250 SSF. Vanadium of max 450 ppm. Ash of max 0.1%. Flash point of min 150 F. Pour point of max 60 F. Al+Si of max 80 ppm. Compatibility rating of max 2. Water of max 0.5%.
Conversion Rates: OPIS publishes bulk residual fuel oil assessments in US$/barrel and US$/metric ton using the following conversion rates from barrels to metric tons: 0.3% ULSFO 6.84; 0.5% VLSFO 6.702; 1% SFO 6.35; 3% HSFO 6.35.
Assessment Timing: OPIS bulk residual fuel oil price assessments take into account all transactions throughout the trading day, typically from 9 a.m. to 5:15 p.m. Eastern time, with the exception of the U.S. Atlantic Coast, where trading hours extend from 8 a.m. to 5:15 p.m. Eastern time. OPIS editors track spot markets on a full-day basis and daily ranges reflect confirmed trades by timing, volume, product and location. Editors reserve the right to exclude any deal or deals they deem “not reflective” of prevailing or fair market value. These deals may be mentioned in our written commentary, however. Residual fuel spot trading overviews are also considered as part of the assessment. A transaction that occurs at 9:00 am EST may be less relevant than a trade that occurs at 5:00 pm EST as fuel oil markets can gain or lose value, but nonetheless does indicate market value. Residual fuel spot trading overviews are also considered as part of the assessment.
Qualifying Transactions: OPIS assesses fuel oil trades delivered from 7-9 days forward in the U.S. Gulf Coast and 10-15 days forward in the U.S. East Coast. Prices are published in US$/bbl and $/metric ton. Individual local taxes are not considered for assessment.
Priority is given to deals done, with bids and offers also considered. In the absence of market positions, fuel oil swaps prices will be considered in making assessments.
Typicals on size:
• U.S. Gulf Coast: 45,000 bbl
• U.S. East Coast: 50,000 bbl
Swaps: Swaps assessments are based on information received from active market participants including brokers and traders. OPIS assesses swaps for the prompt month, the prompt month plus one, and the prompt month plus two. The prompt month rolls on the 15th of each month, except for February which rolls on the 14th.
Crack Spreads: Crack spreads for VLSFO barges and HSFO barges are calculated vs front-month Brent at settlement.
LSVGO vs Bunker Spread: OPIS calculates the end of day spread of LSVGO barges basis Gulf Coast vs 0.5% VLSFO bulk barges and bunkers.
Bunker Fuels Spot Pricing
(Effective March 26, 2020)
OPIS bunker assessments include the main fuels of the shipping industry, Intermediate Fuel Oil (IFO) 380 centistokes (HS 380 CST), very-low-sulfur fuel oil (0.5%S VLSFO) and Low-Sulfur Marine Gasoil (LSMGO).
OPIS adheres to bunker fuel specifications set by the International Convention for the Prevention of Pollution from Ships (MARPOL) in global bunker fuel assessments. As of January 2020, the IMO statutory limit for oceangoing ships is a maximum of 0.5%S, unless that ship is equipped with an exhaust gas cleaning system. In that case, ships can burn fuel with a maximum of 3.5%S. Ships operating within designated Emission Control Areas (ECAs) must burn a fuel with a maximum sulfur content of 0.1%S.
The worldwide market generally follows similar specifications for these grades in all locations. The specifications followed are those defined by the International Organization for Standardization in document ISO 8217:2010 (E) – Petroleum products – Fuels (class F).
HS 380 CST: Specifications: Approximate Kinematic Viscosity: At 50 C, max 380 cst. Flash point 60 C minimum. Pour point (upper) winter quality, 30 C maximum; summer quality, same. Ash 0.10 m/m maximum. Sulfur, statutory requirements. Vanadium max 350 mg/kg. Aluminum plus silicon, 60 mg/kg max; water, 0.5% maximum.
0.5%S VLSFO: Primarily a marine fuel, specifications may vary slightly due to blending but must contain a maximum of 0.5% sulfur and contain characteristics comparable to IFO fuels and must fall within accepted business standards of marine fuels. The final assessment of 0.5%S will take into account the various blends available. Given the wide range of 0.5%S blend specifications, OPIS uses a conversion rate from barrels to metric tons of 6.702, reflecting an average API of 19.
LSMGO: Specifications generally conform with that for DMA. Kinematic Viscosity at 40 C, 1.5 minimum CST, maximum 6 cst; Flash point 60 C minimum; pour point (upper) winter quality, – 6 C; pour point upper, summer quality, 0 C; Ash 0.01% maximum; Sulfur, statutory requirements. Cetane, minimum 40.
Assessment Timing: Americas bunker fuel assessments take into account all transactions throughout the trading day, typically from 9 a.m. to 5:15 p.m. Eastern time, with the exception of the U.S. Atlantic Coast, where trading hours extend from 8 a.m. to 5:15 p.m. Eastern time. OPIS editors track spot markets on a full-day basis and daily ranges reflect confirmed trades by timing, volume, product and location. Editors reserve the right to exclude any deal or deals they deem “not reflective” of prevailing or fair market value. These deals may be mentioned in our written commentary, however. In the event a grade of fuel is not reported, the assessing editor will use historical data and product spreads to assess the product until market provides a price level. A transaction that occurs at 9:00 am EST may be less relevant than a trade that occurs at 5:00 pm EST as fuel oil markets can gain or lose value, but nonetheless does indicate market value. Residual fuel spot trading overviews are also considered as part of the assessment.
Qualifying transactions
OPIS assesses bunker trades delivered from 3-7 days forward in the U.S. East Coast, U.S. Gulf Coast, Latin and Central America. The U.S. West Coast, because of operational procedures, has a delivery period of 7-10 days of trade agreement. Price: OPIS bunker assessments are published in $/metric ton. Individual local taxes are not considered for assessment. Delivered trades will take into account the published barging charges for individual ports. Average barging prices at each port published by OPIS are updated regularly by market editors.
Typicals on size:
Barging Rates: OPIS publishes barging rates for ports where marine fuels are assessed. These rates are gathered and updated on a regular basis from barging companies and marine fuel suppliers and are subject to change with market conditions.
BTU Indicator: OPIS provides a general indicator of BTUs (energy content) and cost for those BTUs for several products. While actual BTU varies within each grade according to API and density, the indicator gives a general estimate of BTUs per US$ spent.
(Updated March 1, 2021)
ARA Bulk Barges (FOB)
OPIS adheres to bunker fuel specifications set by the International Convention for the Prevention of Pollution from Ships (MARPOL) in global bunker fuel assessments. As of January 2020, the IMO statutory limit for oceangoing ships is a maximum of 0.5% sulfur (S), unless that ship is equipped with an exhaust gas cleaning system. In that case, ships can burn fuel with a maximum of 3.5%S. Ships operating within designated Emission Control Areas (ECAs) must burn a fuel with a maximum sulfur content of 0.1%S.
The worldwide market generally follows similar specifications for these grades in all locations. The specifications followed are those defined by the International Organization for Standardization in document ISO 8217:2010 (E) – Petroleum products – Fuels (class F). Prices are published in dollars per metric tons and dollars per barrel. OPIS recognizes the wide range of 0.5% sulfur blend specifications traded, and the 0.5% sulfur assessments reflect value in line with the ISO 8217:2010 standards. OPIS uses a conversion rate from barrels to metric tons of 6.702, reflecting an average API of 19. OPIS assessments include High Sulfur Fuel Oil (HSFO), HS 380 centistokes (CST), Very Low Sulfur Fuel Oil (VLSFO), Diesel Marine Oil (DMA) and Low Sulfur Marine Gasoil (LSMGO).
DMA
OPIS450 DMA Barge Assessments reflect the real-time value of prompt-loading Diesel Marine Fuel A in the ports Antwerp, Rotterdam, Amsterdam (ARA) between 9 a.m. and 4.30 p.m. London time. The closing time will be 12.30 p.m. during certain holiday periods listed in the OPIS Holiday Schedule.
The assessment is based on 1,000 to 3,000 metric ton FOB barges (plus or minus 5% in buyer’s option), loading 3-7 days forward on Monday and Tuesday, and 5-9 days forward on Wednesday, Thursday and Friday. Loading times may be changed to allow trade during unusual trading conditions. The specification is DMA ISO8217 v 2010, dyed.
OPIS requires buyers to nominate a minimum of two ports from the ports of Antwerp, Rotterdam and Amsterdam when bidding for prompt loading Marine Diesel barges. Sellers must specify a single port when posting offers.
Product differentials versus either the front or second month ICE Low Sulfur (LS) Gasoil future are used in the assessment process.
Traders should nominate either EFP or Trigger or EFP/Trigger as their option. A bid referencing EFP/Trigger will be in the seller’s option, and an offer referencing EFP/Trigger will be in the buyer’s option.
Trigger or EFP trades will be concluded per metric ton in U.S. dollars below/above or equal to the price of either front or second month ICE LS Gasoil futures to be exchanged to the nearest 100 metric tons, see minimum contract details.
Bids, offers and trades throughout the day, expressed as a differential to the front-month LS Gasoil future, are compared to a notional reference differential value (RV). Differentials based on the second month LS Gasoil future will be calculated equivalent to the front month, using the settle prices for the futures on the day. OPIS450 will roll forward to the next month’s LS Gasoil future on the day of the expiry.
The RV is derived from the forward curve of the FOB DMA/MGO barge swap at 4:30 p.m. London time, rounded to the nearest 25 cents. The RV will be calculated by using the gradient of the forward curve of the outright FOB FARAG Marine Gasoil barge swap between the balance month and first month, or first month and second month when balance month trade is no longer available or sufficiently liquid, and extrapolated to the day of assessment.
In the absence of swap paper, OPIS will use the previous differential assessment as the RV, and/or refer to market survey.
The differential value will change at the minute when there is a trade, or a higher bid or lower offer. Over a day, the first trade, or bid or offer to pass the RV, will set the value for the preceding minute marks as well as the following minute marks, until there is a higher bid or lower offer or trade to set value.
New bids and offers should be placed sequentially, with guidance of $1/mt increments to the current differential value to be considered for assessment. In the event of a cross over between bid and offer, the offer will take precedence.
Data Submission
For bids or offers to be considered in OPIS’s price assessment, traders are recommended to nominate a recognised broker to relay their indications to OPIS editors. Editors will blast the indications, including counterparty name, volume, loading dates, and ports as well as the name of the acting broker and timestamp, to market participants over the OPIS ICE Chat channel. The bid or offer must stay with the nominated broker, and be live and executable in real time. In the event of a trade, standard industry nomination and pricing procedures apply.
OPIS editors will confirm the validity of a bid or offer with the broker at the time of the initial posting by phone, as well as subsequent moves during the day.
In addition, OPIS considers verified bids, offers and trades posted on other trading platforms. For bids and offers posted on an alternative platform, the alternative platform name will be added onto the OPIS ICE Chat channel. A change to the bid or offer on another platform must be relayed in real-time to OPIS.
In the event of a trade on another platform, or the withdrawal of the bid or offer on another platform, the corresponding bid or offer on the OPIS ICE Chat channel is cancelled.
After market close, OPIS editors will review the data submitted and may remove bids, offers or trades that are deemed unrepresentative of market value. OPIS editors may disregard pricing data from a counterparty if they are subject to credit or trading restrictions.
On days when there is no activity, or no trade during the day or bids or offers seen that challenge the RV, the editor will use the RV to set the assessment.
The spreadsheet used for the assessment will be available on request to market participants.
OPIS450 DMA Market Minimum Contract Terms
The contract for a DMA barge trade should adhere to the following minimum contract provisions, developed and developing in consultation with spot market actors.
Please note:
a. Ops. contact Seller: ……………
b. Ops. contact Buyer: ……………
VLSFO and HSFO
In northwest Europe, OPIS publishes high sulfur fuel oil barge (HSFO) and 0.5% very low sulfur fuel oil (VLSFO) barges, between 2,000 and 5,000 tons basis the Amsterdam-Rotterdam-Antwerp barge market (ARA), loading 3-15 days forward Monday and Tuesday, and 5-15 days forward Wednesday, Thursday and Friday. Prompt loading dates may be changed due to public holidays.
In the absence of physical activity, OPIS will refer to the swaps curve, market feedback, and spread indications versus the relevant Singapore price. For VLSFO barges, a differential value versus LS Gasoil front month futures is assessed, reflecting either deal information or bid and offer ranges, or by deducting a flat price assessment from the settle price of the front month LS Gasoil future settle.
Northwest Europe Bulk Cargoes (CIF)
The DMA CIF Northwest Europe (NWE) value will be derived as a fixed differential to the DMA FOB barge price. Prices are published in dollars per metric ton and dollars per barrel, using a conversion rate of 7.08.
The VLSFO NWE value will be derived as a fixed differential to the VLSFO FOB barge price. Prices are published in dollars per metric ton and dollars per barrel, using a conversion rate of 6.702.
The HSFO NWE value will be derived as a fixed differential to the HSFO FOB barge price. Prices are published in dollars per metric ton and dollars per barrel, using a conversion rate of 6.35.
Mediterranean Bulk Cargoes (CIF)
The VLSFO Mediterranean cargo assessment will reflect cargoes of 25,000 to 30,000 metric tons delivered CIF basis Genoa/Lavera. Other ports may be considered for assessment within the western Mediterranean region. The assessment reflects VLSFO for delivery 10-25 days from date of publication.
In the absence of physical information, OPIS will refer to market feedback, VLSFO swaps, netbacks from Singapore, and/or the relationship between FOB HSFO barge and CIF Mediterranean HSFO cargoes. Prices are published in dollars per metric ton and dollars per barrel, using a conversion rate of 6.702.
The HSFO Mediterranean cargo assessment will reflect cargoes of 25,000 to 30,000 metric tons delivered CIF basis Genoa/Lavera. Other ports may be considered for assessment within the western Mediterranean region. The assessment reflects HSFO for delivery 10-25 days from date of publication. In the absence of physical information, OPIS will refer to market feedback and HSFO swaps. Prices are published in dollars per metric ton and dollars per barrel, using a conversion rate of 6.35.
European Bunker Assessments
OPIS assesses bunker trades delivered from 3-10 days in Rotterdam, Antwerp, Hamburg, Gibraltar, Piraeus and Istanbul. The delivered barges assessed are between 1,000 and 3,000 metric tons. OPIS collects pricing information through the day until 4:30 p.m. London time.
(Updated March 26, 2020)
OPIS bunker assessments include the main fuels of the shipping industry, Intermediate Fuel Oil (IFO) 380 centistokes (CST), VLSFO and Marine Gasoil (MGO), and LS Marine Diesel.
OPIS adheres to bunker fuel specifications set by the International Convention for the Prevention of Pollution from Ships (MARPOL) in global bunker fuel assessments. Under amendments to Annex VI of the convention, high sulfur bunker fuel supplied at major global bunkering locations from 2012 onwards must contain a maximum of 3.5% sulfur, and 0.1% sulfur when operating within the designated Emission Control Areas worldwide. Moving forward to Jan. 1, 2020, the global specification for sulfur content will be capped at 0.5%S.
Asia Bunker Fuels Spot Pricing
Timestamp
Singapore delivered bunker fuel assessments take into account transactions, bids and offers through the trading day up to 5:30 p.m. Singapore time.
Fujairah delivered bunker fuel assessments take into account transactions, bids and offers through the trading day up to 5:30 p.m. Singapore time.
Editors reserve the right to exclude from the assessment process anomalous transactions, bids and offers. These can include transactions, bids or offers that differ significantly from other data points collected in a liquid market.
In the absence of sufficient liquidity in the market for any particular grade, product spreads will be considered. For example, if no price data was collected for the 0.5% VLSFO bunker grade, it will be assessed as a spread to the HS 380 CST grade or 10ppm gasoil.”
Delivery Timing
Singapore: delivering 3-12 days forward from date of publication
Fujairah: delivering 3-7 days forward from date of publication
Size
Singapore: 500-2,500 mt
Fujairah: 500-1,500 mt
Specifications
HS 380 CST:
Approximate Kinematic Viscosity: At 50 C, max 380 cst.
Flash point 60 C minimum.
Pour point (upper) winter quality, 30 C maximum; summer quality, same.
Ash 0.10 m/m maximum.
Sulfur, statutory requirements.
Vanadium max 350 mg/kg.
Aluminum plus silicon, 60 mg/kg max;
water, 0.5% maximum
0.5%S VLSFO: Specifications may vary slightly due to blending but must contain a maximum of 0.5% sulfur and contain characteristics comparable to IFO fuels and must fall within accepted business standards of marine fuels.
Low-Sulfur Marine Gasoil:
Specifications generally conform with that for DMA.
Kinematic Viscosity at 40 C, 1.5 minimum CST, maximum 6 cst;
Flash point 60 C minimum;
pour point (upper) winter quality, – 6 C; pour point upper, summer quality, 0 C;
Ash 0.01% maximum; Sulfur, statutory requirements. Cetane, minimum 40.
Low-Sulfur Marine Diesel: OPIS assess prices of low-sulfur marine diesel oil that generally conform with that of DMB ISO 8217:2010 with a maximum sulfur content of 0.1%.
Swaps: Swaps assessments are based on information received from active market participants including brokers and traders. OPIS assesses swaps for the prompt month, the prompt month plus one, and the prompt month plus two. The prompt month rolls on the 15th of each month, except for February which rolls on the 14th.
Crack Spreads: Crack spreads for VLSFO barges and HSFO barges are calculated vs Brent at 16:30 Singapore time.
BTU Indicator: OPIS provides a general indicator of BTUs (energy content) and cost for those BTUs for several products. While actual BTU varies within each grade according to API and density, the indicator gives a general estimate of BTUs per US$ spent.
Asia Bulk Fuel Oil Spot Pricing
(Updated March 26, 2020)
Timestamp
The fob Singapore bulk fuel oil 380 CST HSFO spot assessment takes into account transactions, bids and offers through the trading day up to 4:30 p.m. Singapore time.
The Singapore bulk fuel oil market trades on a fixed price and floating price basis. Price data of either type will be considered for assessment.
The fob Fujairah bulk fuel oil 380 CST HSFO spot assessment will be based off a freight netback from the Singapore bulk fuel oil 380 CST HSFO spot assessment. The Arab Gulf-to-Singapore 80,000 mt freight rate will be considered for the netback.
Delivery Timing
Delivering 15-30 days forward from date of publication.
Size
20,000-40,000 mt
Specifications
Kinematic Viscosity: maximum 380 cst
Flash point: 66 C minimum
Pour point: 24C maximum
Ash: 0.10% maximum
Sulfur: 3.5% maximum
Vanadium: 300 ppm maximum
Aluminum plus silicon: 80 ppm maximum
Water: 0.5% maximum
Swaps: Swaps assessments are based on information received from active market participants including brokers and traders. OPIS assesses swaps for the prompt month, the prompt month plus one, and the prompt month plus two. The prompt month rolls on the 15th of each month, except for February which rolls on the 14th.
Crack Spreads: Crack spreads for VLSFO barges and HSFO barges are calculated vs Brent at 16:30 Singapore time.
BTU Indicator: OPIS provides a general indicator of BTUs (energy content) and cost for those BTUs for several products. While actual BTU varies within each grade according to API and density, the indicator gives a general estimate of BTUs per US$ spent.
OPIS PetroChemWire Ethylene Methodology
OPIS PetroChem Wire publishes closing prices for ethylene at the close of each trading day for two ethylene systems:
OPIS PetroChem Wire’s spot market information is gathered from the market at large.
All deals, bids and offers are directly confirmed to be firm and valid by editors employed by OPIS PetroChem Wire.
OPIS PetroChem Wire editors reserve the right to exercise editorial judgment in prioritization of information and also the option to not include certain information in its valuation process due to lack of clarity or lack of detail needed to confirm information.
The following methodology contains the guiding concepts OPIS PetroChem Wire editors use. Ultimately, all valuations are at the discretion of editors’ judgement.
Closing Daily Price Assessment / Front Month
Delivery Range
OPIS PCW market assessments commonly use the terms “prompt” and “any” to describe the timing of product delivery. Definition of timeframes for these terms varies from market to market and from product to product. In general, however, “prompt” refers to product expected to make delivery within a week while “any” refers to product expected to make delivery after a week’s time but before the end of a month.
OPIS PCW assesses closing values as the most recently completed transaction UNLESS a bid is above that transaction or an offer is below it “at the close” – assessing value above an unanswered bid or below an unanswered offer. The close is currently defined as 3 pm US Central Time. Each system is assessed separately.
Example 1: May ethylene trades at $0.50/lb at 1 pm US Central Time. Between 2 pm and 3 pm, it is bid at $0.49/lb and offered at $0.55/lb. PCW would assess the closing price of May at the transacted level of $0.50/lb.
Example 2: May ethylene trades at $0.50/lb at 1 pm US Central Time. At 2:30 pm, it is bid higher, at $0.51/lb, but the lowest offer is $0.55/lb. At 3 pm, May is still bid at $0.51/lb and offered at $0.55/lb. No transactions were concluded. PCW would assess the closing price of May at the bid level of $0.51/lb, higher than the transacted level from earlier in the day.
Priority of Information
In determining values for each day’s assessment, a variety of information is considered. Some information is inherently more influential. In ranking order, information of the following type is considered when assessing cash market prices:
Forward Curve Price Assessments
OPIS PetroChem Wire publishes daily forward curves for ethylene basis FOB MtB-EPC and basis FOB Choctaw that includes price assessments for delivery time frames extending 24 months into the future. Forward price assessments are determined by:
Calendar Averages
OPIS PetroChem Wire publishes Calendar Averages on the last business day of each month for its three daily ethylene assessments (Mont Belvieu-EPC and Choctaw). These averages are simple arithmetic averages of the daily closing prices starting on the first business day of each month, such as April 1-30.
Weighted Averages
OPIS PetroChem Wire publishes a weighted monthly average price for ethylene on the last business day of each month.
OPIS PetroChem Wire collects spot market transaction information each day for use in calculating its weighted averages each month.
Deals must be reported and confirmed by at least one deal participant.
Deal information must include transaction date, volume, delivery month and transmission system.
Only deals with an outright price are used to calculate the weighted averages.
Deals concluded on an index basis are not included by OPIS PetroChem Wire for consideration in its weighted averages.
Ethylene deal information is published for delivery to or from the common storage systems (MtB-EPC and Choctaw), and deal information from proprietary pipeline and storage systems is also published, referred to as either Texas-Other (TX-O) or Louisiana-Other (LA-O).
Volumes of deals are published in aggregate form and not on a deal-by-deal basis.
30-Day Weighted Average Prices are determined by dividing the sum of deal prices by the sum of deal volume for transactions for delivery during a given month that occurred between the first business day of that month and the last business day of that month, such as deals for May delivery that transacted between May 1 and May 31.
45-Day Weighted Average Prices are determined by dividing the sum of deal prices by the sum of deal volume for transactions for delivery during a given month that occurred between the 16th day of the month preceding that month and the last business day of that month, such as deals for May delivery that transacted between Apr 16 and May 31.
Volumes used to calculate the averages are published in aggregate form as:
Product Specifications
OPIS PetroChemWire Propylene Methodology
OPIS PetroChem Wire publishes closing prices for two grades of propylene at the close of each trading day.
All deals, bids and offers are directly confirmed to be firm and valid by editors employed by OPIS PetroChem Wire.
OPIS PetroChem Wire editors reserve the right to exercise editorial judgment in prioritization of information and also the option to not include certain information in its valuation process due to lack of clarity or lack of detail needed to confirm information.
The following methodology contains the guiding concepts OPIS PetroChem Wire editors use. Ultimately, all valuations are at the discretion of editors’ judgement.
Closing Daily Price Assessment / Front Month
Delivery Range
OPIS PCW market assessments commonly use the terms “prompt” and “any” to describe the timing of product delivery. Definition of timeframes for these terms varies from market to market and from product to product. In general, however, “prompt” refers to product expected to make delivery within a week while “any” refers to product expected to make delivery after a week’s time but before the end of a month.
OPIS PCW assesses closing values as the most recently completed transaction UNLESS a bid is above that transaction or an offer is below it “at the close” – assessing value above an unanswered bid or below an unanswered offer. The close is currently defined as 3 pm US Central Time. Each system is assessed separately.
Example 1: May PGP trades at $0.50/lb at 1 pm US Central Time. Between 2 pm and 3 pm, it is bid at $0.49/lb and offered at $0.55/lb. PCW would assess the closing price of May at the transacted level of $0.50/lb.
Example 2: May PGP trades at $0.50/lb at 1 pm US Central Time. At 2:30 pm, it is bid higher, at $0.51/lb, but the lowest offer is $0.55/lb. At 3 pm, May is still bid at $0.51/lb and offered at $0.55/lb. No transactions were concluded. PCW would assess the closing price of May at the bid level of $0.51/lb, higher than the transacted level from earlier in the day.
Priority of Information
In determining values for each day’s assessment, a variety of information is considered. Some information is inherently more influential. In ranking order, information of the following type is considered when assessing cash market prices:
Minimum Volume
PGP: Volumes of 3 million pounds or more for a single month’s delivery are considered to be standard volumes. Volumes of less than 3 million pounds may be considered to represent value at the discretion of OPIS PetroChem Wire editors.
RGP: Volumes of 20 thousand barrels or more for a single month’s delivery are considered to be standard volumes. Volumes of less than 20 thousand barrels may be considered to represent value at the discretion of OPIS PetroChem Wire editors.
Forward Curve Price Assessments
OPIS PetroChem Wire publishes a daily forward curve for PGP basis FOB MtB-EPC that includes price assessments for delivery time frames extending 24 months into the future.
Forward price assessments are determined by:
Calendar Averages
OPIS PetroChem Wire publishes Calendar Averages on the last business day of each month for its two daily propylene assessments (PGP and RGP). These averages are simple arithmetic averages of the daily closing prices starting on the first business day of each month, such as April 1-30.
Weighted Averages
OPIS PetroChem Wire publishes a weighted monthly average price for propylene on the last business day of each month.
OPIS PetroChem Wire collects spot market transaction information each day for use in calculating its weighted averages each month.
Deals must be reported and confirmed by at least one deal participant. Deal information must include transaction date, volume, delivery month and transmission system. Only deals with an outright price are used to calculate the weighted averages. Deals concluded on an index basis are not included by PetroChem Wire for consideration in weighted averages.
Propylene deal information is published for delivery to or from the common storage systems of MtB-EPC, as well as deal information from proprietary pipeline and storage systems is also published, referred to as either Texas-Other (TX-O) or Louisiana (LA).
Volumes of deals are published in aggregate form and no on a deal-by-deal basis.
30-Day Weighted Average Prices are determined by dividing the sum of deal prices by the sum of deal volume for transactions for delivery during a given month that occurred between the first business day of that month and the last business day of that month, such as deals for May delivery that transacted between May 1 and May 31.
45-Day Weighted Average Prices are determined by dividing the sum of deal prices by the sum of deal volume for transactions for delivery during a given month that occurred between the 16th day of the month preceding that month and the last business day of that month, such as deals for May delivery that transacted between Apr 16 and May 31.
Volumes used to calculate the averages are published in aggregate form as:
Product Specifications
OPIS PetroChem Wire Resins Methodology
OPIS PetroChem Wire publishes prices for the following resins on each US business day.
FOB Houston
FOB Chicago
Delivered East of the Rockies
Delivery Range
For each of the above resins, a daily bid, offer and closing price is published for the current month. For the prices that are basis FOB Houston and FOB Chicago, forward pricing is also published for months 2-24. Delivered East of the Rockies basis prices reflect generic prime railcar transactions between resellers (brokers/distributors) and end users. Prices are published on a $/lb basis.
Price Description and Methodology Material Certification
OPIS PCW resin prices are published daily and are for spot transactions for prime and generic prime material understood to be certified as such by a major producer or distributor. Branded prime material can be considered in the absence of information about generic prime material.
Delivery Location
Prices reflect delivery for locations as described:
For bilateral transactions, PCW editors will give primary consideration to transactions that include 30 day payment terms.
Volume Standards
Volumes considered to be standard are between 1 and 5 railcars. Volumes greater than 5 railcars will be considered in the absence of smaller-volume transactions, but will be analyzed as its relative value as a bulk-volume deal.
Priority of Information
In determining values for each day’s assessment, a variety of information is considered. Some information is inherently more influential. In ranking order, information of the following type is considered when assessing cash market prices:
OPIS PCW publishes a bid, offer and closing price for each resin category described above. A bid or an offer is considered to be firm when it is demonstrated to be available to the market-at-large. Such demonstrations could include posting bids and/or offers through a voice broker or an electronic trading platform. OPIS PetroChem Wire editors must reserve the right to exercise editorial judgment in not including certain information in its daily published information either for lack of clarity or lack of detail needed to confirm information.
Product Specifications
Please direct questions to Kathy Hall at 720.48. 6288 / Kathy@petrochemwire.com.