2017 Year-End Oil Market Trends to Watch
Don’t expect the last 70 days in the 2017 petroleum markets to match the drama witnessed summer into fall.
Storm threats should be rare and unless there is a “Black Swan” economic event, the United States is on some of the most stable economic ground seen in two decades.
But beware overzealous projections from crude oil bulls. Year end oil market trends show global oil is indeed rebalancing, but they took many quarters to get sloppy. Expect at minimum three or four quarters of further “cleaning up” before stasis is restored.
October brought plenty of talk of a renewed geopolitical premium, thanks to lower oil flows from Northern Iraq and the threat of further sanctions against Iran. Yet, the market couldn’t sustain rallies despite widespread “expert” predictions that $60/bbl oil is imminent.
Oil traders would love to see more volatile markets. From 2011 through 2014, volatility was akin to the scoring one sees in arena football or the NBA. More recently, narrow ranges have been the norm with crude oil trading often similar to World Cup soccer matches.
OPIS looked at the remainder of 2017 and rendered prophesies on year end oil market trends:

Crude Oil: All About Exports
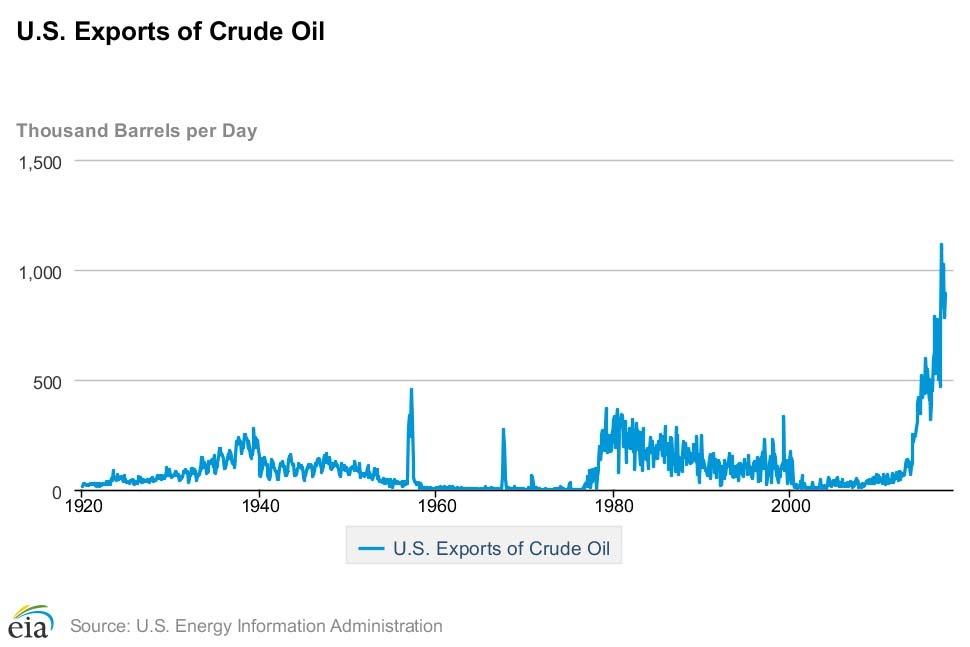
Expect more records to be smashed for U.S. crude oil exports and don’t believe previous talk that suggests it’s logistically impossible to export more than, say, 2-million b/d of crude. Texas alone has enough dock space and suitable arbitrage economics to move far more crude. Weekly tallies of 15-million to 20-million barrels of crude going to several continents are likely. Traders long WTI will tout these numbers as potential tipping points. Traders in Brent and other global crudes may worry that the gelatinous belly of U.S. crude is spreading to international ports, perhaps auguring weakness in Brent, Dubai and other blends.
Global markets have never seen this sort of maritime liposuction. North American markets were recently battered by several “1-in-100 year” storms. But, the burgeoning U.S. export market has no precedent, not in the 20th nor the 21st century. Ostensibly, the movement should narrow the gap between disadvantaged U.S. crude (WTI at Cushing) and Brent.
But “expert” oil analysts operate with models that have never seen these data points as part of the oil price calculus. It’s possible that the United States could ship 100-million barrels or more of crude to other continents in the remainder of 2017. If prices are accommodative, there is the potential for the United States to provide a billion barrels of crude to the rest of the world in 2018 or 2019.

So, world crude markets may relax soon thanks to completed North Sea maintenance and lower European refinery runs, and the U.S. market should tighten.

Gasoline: Premium Head Fake
Retail marketers probably won’t get the typical “big inning” that comes with the traditional autumn plunge in wholesale gasoline prices and relatively stable retail numbers. But, watch for some downward pressure on premium gasoline.
The weakness in premium may be the ultimate head fake. Auto manufacturers are going to need more octane in the next 5-15 years in order to manufacture the high compression engines that run best on 93 octane or better blends.
There may indeed be an octane shortage in the next decade, but it hasn’t arrived in 2017. If anything, some consumers have downshifted in their fuel choices, thanks to storm-inspired surges to $3/gallon and higher for premium gas.
Premium production currently fetches a premium return for most refiners. Mid-October saw high octane gasoline fetch a price premium of only about 10cts gal more than lower octane blendstocks at the Gulf Coast. Yet, many refiners and retailers are charging 50-60cts/gal more for premium gasoline at the distribution terminal or the pump.
OPIS does suggest that most gasoline prices will move lower in the remainder of the fourth quarter, but supply and demand fundamentals don’t suggest a cascade lower like those witnessed in 2015 and 2016. One can blame the loss of gasoline production from the hurricane aftermaths, as well as some light maintenance that may continue into early November.
And recollect that wherever the gasoline bottom is established (the most common nadir for RBOB futures is early December), that number will represent not stability, but instead the potential launching pad for the 2018 rally.
- Run history to see prior-year market lows. Click here
One trend to watch especially close in end 2017: consumer driving habits. November and December used to be very consistent periods for gasoline consumption, thanks to the perception that shopping at suburban and rural shopping malls was an act of patriotism. One year ago, the first two weeks of December brought some of the poorest non-winter demand weeks of the year. Shopping online doesn’t require any fossil fuels.

Distillate
Trading NYMEX ULSD futures with a short time horizon has worked perfectly for sellers for about two months. If a company sold ultra-low sulfur diesel above $1.80/gal, they could take a day trader’s profit seven times in the last 34 business days. The price moved above $1.80/gal some 16 times in the same period and the longest one had to wait to profitably buy back was 7 days.
But OPIS sources suggest that diesel might represent the most magical molecule for the rest of 2017. Global inventories are tight and whether the diesel goes for heating, construction, agriculture, mining or other purposes, demand seems brisk.
Our OPIS Demand Report suggests that the EIA has typically been overstating motor fuel demand this year. But many of the same sentinels tell OPIS staff that diesel demand is probably being understated. This could be the product that has another substantial leg higher, and ULSD will at the very least outperform gasoline and crude.
