2018 Gasoline and Diesel Prices by Market
The year 2017 saw gasoline and diesel prices shaped by ever-volatile underlying oil prices, supply-and-demand-crippling meteorological events and the push and pull of domestic and global import and export trends.
Enjoying a look back at what we forecast for 2018 gasoline and diesel prices? If you are interested in an update, with our editors’ picks for the top trends facing each of the spot markets in 2019, please click right here.
If not, please continue to enjoy a look back at 2018’s forecasts.
Gasoline and diesel values in the year 2018 will no doubt be impacted by these ever-present factors and many more. In the OPIS 2018 Outlook Forecast, our analysts expect a modestly more expensive year for gasoline. Their best information suggests prices between $2.40-$2.50/gal, with substantially more volatility than all but the hurricane-impacted months of 2017.
On the diesel side, 2017 prices averaged just about $2.60/gal, 33cts/gal above 2016. It’s expected that 2018 will be a more expensive year.
- For our analysts’ updated forecast for the 2018 U.S. oil market, click here.
While national trends are, for sure, critical to track, anyone in the fuel market knows prices can gyrate wildly market-by-market. What stands to influence 2018 gasoline and diesel prices on the local level? For that, we need to turn to the spot markets.
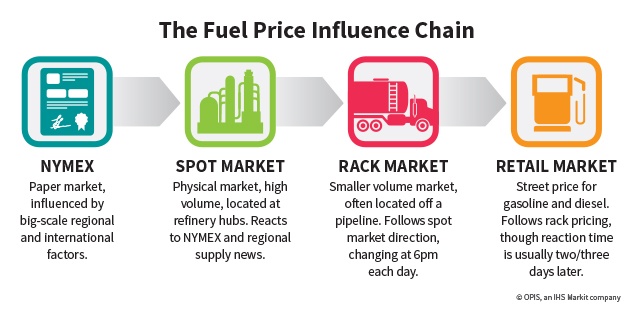
A Quick Review of the Price Influence Chain
Remember, the price you pay for gasoline and diesel at the retail level is not just dropped from the sky.

The price influence chain begins in the futures market, where paper contracts of fuel are traded transparently. You can read more about the futures market here.
The actual fuel that is produced in a refinery is priced at a premium or discount to that futures market. That so-called spot price is then used to derive the value that wholesalers pay at one of some 400 rack markets across the United States. The rack price then influences the price paid by consumers at the retail level.
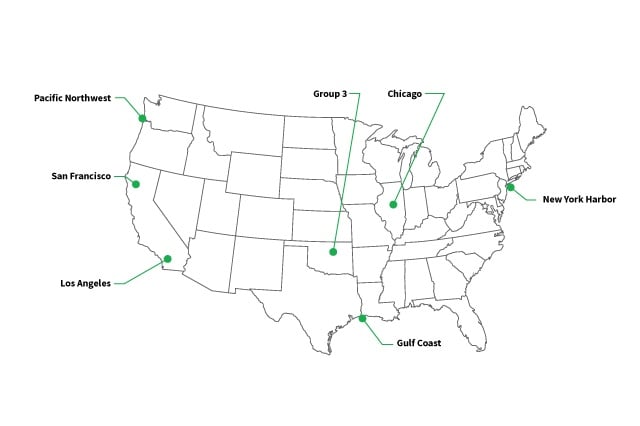
So, to truly understand what is making a local price go up or down, it is important to understand what’s happening at the spot market most closely associated with a given region. Here’s a map to give you some reference.

Our spot editors pulled together the major trends that will steer prices in their markets for the next 12 months. Here are their top takeaways:
Gulf Coast
- With some weather experts saying larger and stronger storms could become more common, hurricane season disruptions could happen more frequently in the U.S. refining sector. Hurricane disturbances remain the wild card for Gulf Coast spot prices and, if another storm or set of storms threatens the refining capacity of the region, prices will likely spike and mirror the movement seen in 2017.
- Total refining operational capacity in the PADD3/Gulf Coast region has jumped from 8.7 million b/d on average in 2012 to 9.7 million b/d on average in 2017. It’s poised to continue to move higher as plants add new units, tap technology to further leverage output from existing units and as opportunities for shipping outlets grow.
- One of the biggest markets that will see an influx of products from the U.S. Gulf Coast will be Mexico. Brazil was also a high-volume importer of U.S. distillate in 2017, with the peak intake in the first nine months occurring in May.
Group 3 and Chicago
- Midwest cash basis differentials remained persistently high heading into 2018, sloughing off any tendency to slip into seasonal norms. But with steady regional mogas inventory builds since late October, market sources are optimistic the discounts are around the bend.
- Perhaps the event most anticipated for 2018 is the proposed partial reversal of the east-to-west flowing Laurel Pipeline. Some participants are hopeful the reversal of the 250,000-300,000-b/d Laurel Pipeline could usher in additional stability during winter and spring.
- “Midwest refiners will be able to push product to the East Coast,” said a market participant of the proposed reversal. “There will be competition from the Midwest, East Coast and Gulf Coast for the same barrel and the Midwest has the cheaper economics of all of them.”
New York Harbor
- Bulk refined products prices in New York are poised to kick off 2018 in strong fashion, with prices holding near the higher end of their average ranges of 2017, especially diesel. There has been much stronger diesel demand and many are bullish on prices for the new year.
- Shifting supply dynamics are changing the landscape of the Harbor market. As more fuel is being exported out of the U.S. Gulf Coast, New York stands to see potentially fewer barrels. European markets are seeing growing demand and greater use of gasoline, which could equate to fewer barrels exported to America. On the other hand, Chicago-area refiners want to ship barrels east in competition with New York supplies if the Laurel Pipeline reversal comes to pass.
- Meanwhile, some of the storage facilities on the route from the Gulf Coast to New York may shift storage plays to hold more barrels as infrastructure challenges make local supply more critical to meeting everyday market needs, which also stands to starve the Harbor region.
West Coast
- A major challenge set to linger into 2018 is diminishing West Coast spot market trading liquidity that could lead to heightened price swings. Trading sources say refiners currently have strong power to dictate which way they want the market to go. It was also noted that refiners often don’t go to the open market to meet their needs, but to other refiners instead.
- The ongoing fuel market liberalization in Mexico should offer something for most participants to cheer about heading into the New Year, as exports offer an additional outlet for incremental barrels from California refineries, which have been running at relatively high utilization for a second straight year. Kinder Morgan has created Mexican-specification grades, which gives those with storage in Tucson, Ariz., the opportunity to truck fuel into Mexico. Those with West Texas refineries could also be eyeing this new development.
- California’s retail fuel prices remain by far the highest among the lower 48 U.S. states at above $3/gal, thanks to the state’s myriad costs including federal tax, excise tax, sales tax, Low Carbon Fuel Standard credits and cap-and-trade fees. LCFS credits are expected to surge to $200/credit in 2020, versus current prices at $110/credit, with all of those costs seen as being borne by consumers.
Spot 2018 gasoline and diesel prices are already starting off the year with a bang. In the New York Harbor market, for example, diesel and heating oil values were perched at multi-year highs at press time, as continued cold weather backed an increase in product demand – this in spite of the fact that distillate production has been at an all-time high in the U.S. Northeast. Keep it tuned to OPIS this year to see where this market – and every other spot fuel hub – heads!
