The European styrenics industry has navigated turbulent waters for several years now, with high production costs, stiff international competition, sluggish demand, as well as tightening environmental regulations.
Klaus Ries, with nearly 30 years of experience at chemicals major BASF and extensive involvement in plastics, is the current chair of the Styrenics Sector Group in Plastics Europe (representing styrene monomer and all styrenic-polymer producers). He also serves as president of the Association for European Manufacturers of Expanded Polystyrene (EUMEPS).
In an interview with OPIS editor Fahima Mathé, Ries provides insights into the challenges shaping the styrenics industry’s present and future, discussing strategies for sustainability and growth.
OPIS: Can you give us some insight into the condition of the styrenics industry in Europe that has been hit hard in the current economic downturn?
 Ries: The energy price hike in Europe following the Russian attack on Ukraine hit the energy intensive styrene monomer production quite hard. Before the war, production costs in Europe were already above those of other styrene-producing regions, mainly the U.S. and the Middle East. But with the drastic increase in energy costs, it has been cheaper to import styrene than to buy it produced in the European Union for quite a while now.
OPIS: But haven’t energy costs decreased and now fallen back to levels seen before the war in Ukraine?
Ries: This is correct; however, compared to other regions, the energy costs in Europe are still significantly higher – for example for natural gas is four to five times higher than in the U.S. Consequently, especially imports of monomers increased substantially.
Before I go into details, I would like to highlight that all data provided in this interview are my own estimates based on CMA-data, some non-confidential numbers from associations, and public import statistics – so no guarantees.
In 2018, the EU was still a net exporter of styrene monomer of roughly 30,000 metric tons (mt). But by 2023 the EU had become a net importer of 400,000 mt, corresponding to approximately 10% of installed production capacity. When you also consider the drastic increases in imports of styrenic-polymers into Europe, the trade deficit adds up to a staggering 770,000 mt of styrene monomer (polymer volumes converted into monomers based on their composition)! It means that more than the annual capacity of a modern world-scale styrene monomer plant (600,000 mt) has been replaced by imports in quite a short time. That is quite dramatic.
It is noteworthy that Russia and Iran are also playing a role here. It seems that these countries use Turkey and the Middle East to sell significantly higher styrenics volumes than before 2019. It is not unreasonable to assume that to a significant degree these volumes find their way into the EU. Specifications, product approvals and certificates do not seem to hinder this business in any way. This should be a wake-up call for the EU and its member states.
OPIS: I assume the demand side did not help either?
Ries: You are right. Until 2019, styrene monomer demand was around 5 million mt/year in Europe – matching regional installed production capacity. The subsequent economic crisis that hit Europe following the Covid-19 outbreak decreased demand to just 4 million mt, according to data from the industry and Chemical Market Analytics (CMA) by OPIS.
The increased energy cost in parallel to the low demand put so much pressure on the European producers that around 1 million ton of the European capacity was permanently taken out. As mentioned above, in addition to that, almost 20% (around 770,000 mt) of European styrene demand in 2023 was met by monomer and polymer plants outside the EU. Which means producers operated their units at around 70% capacity, resulting in just a little over 3 million mt of styrene production in Europe.
I hope I am not being overly dramatic here, but the situation is dire for European styrene players who are grappling with falling demand, high production costs and competition with international producers that have a feedstock cost-advantage.
OPIS: How do you foresee the development of supply and demand, say over the next decade, for styrenics in Europe?
Ries: The outlook is mixed, with both challenges and opportunities, a lot of shadow and some light, amid current political trends and the media’s negative focus on plastic. Resulting legislation, such as the recently approved Packaging, Packaging Waste Regulation (PPWR), does not favor plastic materials as such or in comparison with other materials, especially paper-based packaging formats. This has been often set up without proper Life Cycle Analysis or Impact Assessments.
This approach will not allow demand to fully return, especially since some polystyrene applications are directly affected by these developments. Mandatory quota for recycled content, as defined in the PPWR, will also not help fill existing capacities in the longer term.
Further, it is unclear yet what the result of the UN-treaty negotiations on plastics pollution will be. Restrictions on additives, polymers or production caps (regulatory limits or restrictions imposed on the total amount of plastics or specific types of plastics produced) are occupying a lot of the negotiations, leaving little time to address the most pressing matter, which is to effectively prevent plastic from ending up in the environment.
It is well known that plastic pollution has root causes in poor drinking water supply (making plastic bottles a must), a lack of proper waste collection and sorting infrastructure, and a lack of recycling or modern waste incineration facilities, with energy recovery.
A ban on plastic will not help the environment and possibly lead to regrettable substitutions and other related problems such as an acceleration of deforestation due to an uninformed shift to paper-based packaging, a known driver of climate change, or lower hygiene standards, especially in developing countries. With several initiatives such as the Alliance to End Plastic Waste, investment in recycling technologies and capacities, the industry demonstrates its strong willingness to engage in this area.
I do not understand why politicians hesitate to listen to the industry’s solutions and discuss how to implement them best.
OPIS: That’s quite a bleak outlook. What are the positive trends? You mentioned there is some light as well?
Ries: Of course, there is. I am thinking firstly of the Energy Performance of Buildings Directive (EPBD). 36% of the EU’s energy-related greenhouse gas (GHG) emissions come from buildings. This large amount is mainly attributable to the EU’s ancient, energy-inefficient building stock.
Therefore, renovating these buildings and constructing all new buildings according to high energy efficiency standards will be critical to address this vast potential to avoid GHG emissions. The EPBD sets an architecture for member states to define their strategy to reach climate neutrality of building stock by 2050. For example, with the entry into force of law, the member states have until 2026 to develop national building renovation plans, which need to comply with clearly defined reduction targets for primary energy use (residential sector) or need to include measures that even induce mandatory renovation of the worst performing buildings (non-residential sector). That is good news for styrene demand.
Advancements in the building sector provide a unique opportunity in the fight against global warming. Proven technologies and materials already exist and can be immediately applied on a large-scale all over Europe. Especially, the styrenics-polymer expanded polystyrene (EPS) provides excellent insulation performance and is a perfect and cost-efficient solution for this challenge. This material is safe for installers, residents, and the environment alike, and is easy to install in all European countries. Its lifetime matches that of the building itself, making it a sustainable and long-term solution.
But to come back to your earlier question to supply and demand development. Altogether I would say, yes, demand will recover with increasing consumption amid – as just described – huge growth potential in the building sector. However, other factors will prevent the demand from returning to previous levels. Perhaps half a million tons of demand will come back, while the other half million is mere dust in the wind. But the question remains: From which plants will this demand be met and from which region?
OPIS: Will we see further consolidation of European styrenics production capacity? And if so, what is the consequence for supply security?
Ries: I would be very astonished if we did not see further announcements of capacity consolidation in the next 12 to 18 months.
It is clear, if further styrene monomer capacity is taken out, Europe would have to rely even more on imports of styrene. While there is more than enough capacity outside Europe to cover even more of the region’s 4 million mt/year demand, bottlenecks in infrastructure such as tanks, logistics or hurricanes will make this a permanent challenge. Also, the price volatility will increase if ships are delayed, or other disturbances occur.
OPIS: In such a challenging market and regulatory environment, how will the transition progress towards CO2-neutral production and the replacing of fossil fuels with renewable feedstocks?
Ries: The sustainability transition is a major challenge for the energy intensive chemical and plastic industry. Reducing CO2 emissions with the ultimate goal of CO2 neutrality requires new technologies and a lot of green energy. At the same time, the plastics industry must invest further in circularity. All this requires enormous capital expenditure. Investors dislike uncertainties: unclear, inconsistent, and changing regulations will make investments more difficult, if not impossible.
Let me give you an example: The chemical industry has argued that without chemical recycling in combination with a mass balance approach, that defines the rules for attributing the proportion of sustainable raw materials to the end product, it will most likely not be possible to achieve the circularity ambitions of the EU.
After years of discussion on implementing the Single Use Plastic Directive (SUPD), it appears that chemical recycling in combination with mass balance attribution will find acceptance in the rules regarding the calculation of recycled plastic content.
Since a recent motion for a resolution objecting to implementing this act in the EU parliament failed, it is rather likely that implementing the act will be adopted by the member states by the end of this year – albeit with some restrictions strongly hampering the economics of chemically recycled products.
Still, implementing this act will serve merely as a blueprint for future regulation or implementing acts. Our industry must hope that the rules will also be similarly adopted for PPWR. Here, the corresponding implementing act, which affects many more packaging applications in comparison to the SUPD, is not expected before 2026!
Even worse, for other industries or non-packaging plastics applications, investors will have clarity even later, because the main legislation was not completed under the current EU Commission, such as the end-of-life vehicle directive. How can one expect investors to invest hundreds of millions of euros in technologies with unclear acceptance? The same holds true for some other aspects of the SUPD as well as the PPWR.
When it comes to reduction of CO2 emissions the situation is similarly complex. Bio-based feedstocks will play a major role next to recycled feedstock in reducing our industry’s emissions to zero. However, besides regulatory uncertainty there is also the problem of limited availability of renewable feedstocks, such as bio-naphtha, which has several implications.
Firstly, these feedstocks are more costly today and will, due to their projected scarcity and rising demand, remain much more costly than their fossil-based counterparts during the transition.
Secondly, limited availability means that steam crackers in the EU will need to run on certain mixtures of recycled, bio-based, fossil-based and possibly even CO2-based feedstocks (CCU) in the long-run. There will be no scenario in which there is enough feedstock to run crackers on a single sustainable feedstock (to offer products with proven recycled or bio-based content that would not require the mass balance approach).
Yet, regulators, NGOs and even some important brand owners think of the mass balance approach as a short-term tool only needed at the beginning of the transformation. They are lobbying heavily to restrict mass balance rules or propose time limits for their viability in legislation and standardization.
What is so frustrating about this is that neither this hard reality of feedstock limitations nor the economic dimension of this problem seems to be relevant for these parties. Make no mistake: even with mass balance attribution allowed with no imposed restrictions, sustainable feedstock costs alone will already heavily drive inflation during the first years of the transformation and require a substantial willingness to
pay by the end consumers.
The rising social unrest following the high inflation rates of the past two years in European society should be a warning signal to politicians that it is of utmost importance that this transition occurs in the most economical fashion possible. But sadly, feedstock as an integral and unique part of the chemical industry’s transformation is often overlooked by regulators.
Additional costs that will make production even more costly in a green world are the development and implementation of emission-free process technologies, many of which will not yet be available before 2030. Meanwhile, increased risk of carbon and investment leakage due to rising CO2 costs, renewable electricity costs, energy system changes and investments in low-carbon process technologies with high capital and operating expenditure costs will require a stronger focus on industrial competitiveness.
There is more uncertainty for investors lurking within recent developments in chemicals regulation that will raise bureaucratic burdens and ultimately also costs. In summary, the regulatory uncertainties and lack of economic realities make me personally rather skeptical about the long-term industrial competitiveness in the EU and ultimately the likelihood of success of this transformation – unless the next EU
Commission can improve prioritization of regulatory initiatives and is willing to revitalize Europe’s industrial landscape.
OPIS: Which chemical legislation do you refer to and what is your concern?
Ries: With the Chemicals Strategy for Sustainability published under the Green Deal four years ago, we have witnessed a paradigm change towards a fundamentally different assessment of chemical risk and new classification of chemical hazards. The impact will be massive: The European Chemical Industry Council, Cefic, has calculated that one-fifth of the industry’s portfolio will need to change, and customer industries will suffer from ripple effects.
Banning chemicals outright, for example without proper exposure and risk assessment –even if they are only used in small quantities as intermediate products in production, or for research – will limit innovation. This would be fatal at a time when innovations are needed for numerous tasks from energy transformation to carbon management and the circular economy.
As consumers we want to protect ourselves and our families. At the same time, we are seeking certain functions in products. They should be durable or easy to use, help us to save energy or protect us. In the chemical industry, we are used to looking at both sides of the coin: which substances will help us to develop these functions and how we can ensure that the user is safe.
OPIS: How does styrene, and more particularly, EPS, BASF’s most important styrenics polymer, is prepared for the challenges you describe?
Ries: Styrene, is probably the most extensively studied monomer and polystyrene, has been used safely in consumer goods for over 70 years. The BASF invention expandable polystyrene has been around for just as long and the products made from our raw materials are irreplaceable in several transport applications where the cooling chain is important, such as medical products or organs, but also less spectacular but equally important fish boxes. The transport of heavy household goods is also relying on the excellent protective performance of EPS.
Further, I am convinced that EPS boards are one of the most important tools for emission reduction of the building stock because its cost-performance ratio is simply unbeatable and irreplaceable. EPS-solutions are fully recyclable and recycled at scale, available with alternative feedstocks or as CO2-reduced products. The success of such solutions in the market is yet limited due to their higher costs.
OPIS: European Union citizens have elected new Members of the European Parliament in early June. What are your specific expectations for the new Members and the Commission regarding the promotion of industrial development and competitiveness in Europe over the next five years?
Ries: In the past five years, the EU has pursued a highly ambitious agenda on climate and sustainability overall. However, it has only given very limited consideration to the urgency of the industry’s transformation. An enabling framework for industry to succeed in the transformation is still missing in most areas, despite the many challenges we’ve been facing. This has clearly led to a further decline in our competitiveness on a global level.
It is crucial for the incoming legislators to focus on an Industrial Deal to complement the Green Deal. The EU’s industrial base must be strengthened. From a plastics perspective, we need urgently to return to a rational discussion on what is the best material for certain applications and move away from the emotional thinking that all plastics are bad. Risk assessment must remain a major pillar of the policies that concern the chemical and plastic industries. Zero risk does not exist in this world. Risk has to be properly assessed and managed.
I hope for fewer and smarter regulations, less bureaucracy and more coherence, more market mechanisms and, finally, more incentives to encourage the uptake of low-carbon and circular products. We need realistic ambitions that keep the industry on its toes but do not kill innovation or chase entire industries away from the EU – with zero environmental benefits. We need openness towards technological innovation instead of a technophobic attitude.
The EU needs to be competitive with other regions in terms of energy costs, infrastructure quality, lean and fast administrative processes, and a highly skilled workforce.
Does this sound like a challenge? Of course it is – a challenge equally big and significant as the target of combating climate change because one without the other will not succeed.
With the recent wave of petrochemical plant closures across Europe affecting a significant number of facilities and thousands of jobs, some industry sources are proclaiming the “death” of the region’s chemical industry. However, Ashok Kishore, a seasoned petrochemicals trader with decades of experience in Europe and beyond, tells OPIS editor Fahima Mathé that those reports are greatly exaggerated. While Kishore acknowledges the serious challenges ahead, he remains cautiously optimistic about the industry’s ability to adapt and innovate in the face of adversity.
OPIS: Given the recent petrochemical plant closures in Europe, where do you see the European petrochemical industry heading?
 Kishore: What we see happening today is part of a continual evolution of the European petrochemical industry. Chemical plant closures first started in Europe during the early 1990s as the green movement gained strength, especially in Germany. Chemical production, which was also partly the cause of bad effluent, was gradually outsourced and factories in the Ruhrgebiet and Rhineland in Germany were shut down.
If you cast your mind back to the period until the mid-1980s, lead was an acceptable octane booster in motor gasoline. Then, demand for aromatics surged as they were used to replace lead, until tailpipe emission analysis showed that this was not the best solution for solving air pollution problems either.
So, in some ways, plant closures (or modifications) are also a reflection of the evolution of legislation and consumer preferences over the decades.
Companies such as Exxon, Sabic, Dow or BASF all have a global presence and they no doubt find it more economical to produce some chemicals outside Europe, while trying to retain market share. In other cases, they are losing out to competition that can make and supply chemicals more economically and gain access to the European market.
But the overall trend is clear: the EU27 share of the global chemical market declined to 14% in 2022 from 27% in 2002, according to data from the European Chemical Industry Council (CEFIC), a forum of chemical companies across Europe.
However, it is important to note that while Europe’s share of global chemical production has dropped by 13% in 10 years, the value of the market has increased over the same period, rising to €760 billion ($817 billion) from €363 billion. Elsewhere, capital spending increased to €32 billion in 2022 from €13 billion in 2004. If we use BASF as an example, the company’s sales revenue increased to $92 billion in 2022 from $33 billion in 2001.
So, the above shows there is growth in the European chemicals industry, which makes me optimistic, although the flip side is that since the Covid-19 crisis, and further accentuated by the war in Ukraine, there has been a sharp decline in output. This makes me pessimistic about the continuing growth.
Having said that, recently, there’s been an intriguing development with major commodity traders acquiring smaller refineries in Italy and France. While these refineries have a modest chemical output, it raises questions about their future under new ownership. Will the new owners choose to shut down the chemical operations of these refineries? Or will they venture into assets comprising refineries and petrochemical units deeply integrated across sites, along with logistics and supply chain infrastructure (also called Oil to Chemicals or “O2C”), following larger refining majors’ strategies?
Larger refineries equipped with integrated petrochemical plants will be able to compete globally. Similarly, ethane-fed crackers with dedicated feedstock supply lines are expected to thrive.
Overall, though, I tend to lean somewhat towards pessimism in both output and global share of chemical manufacturing in Europe. The INEOS cracker project in Antwerp was expected to add significant ethylene capacity, but development has been stalled. That is bad news.
OPIS: It is clear Europe has faced significant challenges with petrochemical plant closures, and one of the major reasons cited is high production costs. How did Europe get itself into this tough situation?
Kishore: History teaches us fascinating lessons. In the 1970s, during the aftermath of the first oil crisis, many countries in Europe focused on energy security. This led to the establishment of national refineries across different countries within the European Economic Community (EEC), which later became the EU. Each country prioritized its own energy needs and built refineries to cater to domestic demand.
The availability of naphtha, a primary feedstock for petrochemicals at that time, from these national refineries encouraged the development of petrochemical plants as well. These plants spread over Europe were sized to meet domestic market demand rather than designed for larger-scale international competitiveness.
The fragmentation of the industry across multiple countries meant that Europe lacked economies of scale in petrochemical production. Each country’s petrochemical plants were often smaller and less integrated compared to those in regions with either more centralized planning or larger domestic markets, like the United States or Asia. Over time, as global competition intensified and production costs became a critical factor, Europe’s fragmented approach meant that its petrochemical plants struggled to achieve cost competitiveness.
High production cost is, of course, a relative term. Due to a series of economic events and pollution related policies, Europe never got around to making large investments in capacity expansion as demand grew. This slowly led to disadvantages as other parts of the world invested in larger and more modern plants.
No doubt the plants built in Europe from the mid-1970s onwards were very competitive for the period, but this inward-looking approach made them uncompetitive as the world market grew following long years of demand stagnation in the mid-1970s to mid-1980s. The economic downturn which started following the first oil shock and continued for a decade did not help. The two oil crises of the 1970s led to increased oil production and availability from the North Sea, but that has since declined which no doubt affected Europe in terms of competitive feedstock.
The U.S. had the Gulf of Mexico as a feedstock hub, allowing a concentration of refineries and petrochemicals along the Gulf Coast. The Middle East Gulf also had its own oil and gas that allowed Saudi Arabia to build heavily in the 1980s.
Later, increasing prosperity in the region east of Suez led to bigger markets prompting investment in larger sized petrochemical facilities, first in Taiwan and South Korea and then moving on to other countries.
OPIS: How do these challenges impact petrochemical market dynamics, including those for aromatics for example? You’ve traded benzene and its derivatives at major companies, what do you expect?
Kishore: To use a cliché, change will continue to be the only constant. During my career, I have seen aromatics trading companies come and go, with those focused purely on Europe being extremely successful, until they were not. As European dynamics changed, those aromatics companies who spread their wings to other parts of the world and connected these overseas locations to operations in Europe continued to be successful. Those who relied mainly on their European connections had to seek other pastures.
I believe we are at the most mature part of the petrochemical trading cycle. In a bell-shaped curve, we went from very few traders in the mid-seventies to a large number by the late 2000s and back down to very few now.
Those who continue to have a place in the future will have to be willing to compete as well as cooperate with the large global producers and consumers and their offshoots that have trading ambitions. They need to have the financial wherewithal to find a place in an industry where capacity is getting bigger than it ever used to be.
The recent refinery acquisition spree by commodity trading houses will also influence how aromatics trading develops. For example, Trafigura has acquired refineries in Italy and France, and Vitol has made a similar acquisition in Italy. These European acquisitions include small chemical plants, which could impact the local aromatics market.
In contrast, the deal in Singapore involves significant chemical capacity, specifically Glencore/Chandra Asri Group’s acquisition of Shell Energy and Chemicals Park Singapore (SECP) in May 2024. The Jurong facility is notable for its substantial chemical processing capacity (including 1.1 million mt/year ethylene cracker). I wonder if this acquisition underscores a trend where commodity trading houses get involved in larger, more integrated chemical capacity.
Another factor worth mentioning is the dramatic increase in shipping freight into Europe over the last three years. Specifically, this has impacted the trade of benzene and paraxylene from the Middle East and India. While styrene has also been affected, the regular sources of imports from the U.S. Gulf and Saudi Arabia have maintained their supply based on available demand. I believe these increased shipping costs have hit Europe harder than some other markets, adding to the existing challenges.
Overall, the landscape of the petrochemical market, particularly for aromatics, will be shaped by these dynamics. Companies must adapt by broadening their geographic reach, building financial resilience, and navigating the complexities introduced by evolving global trade patterns and cost structures.
OPIS: What role do you think government policy and regulation has in influencing the competitiveness and sustainability of the European petrochemical industry amidst these closures?
Kishore: Back in the 1970s, national governments played a big role in encouraging investment without much regard to other aspects. Now Europe is perhaps amongst the most regulated markets for chemicals. Starting with phasing out of lead in gasoline referred to above and coming to the era of biofuels, the government has played a role in influencing investment every step of the way. If it wasn’t for subsidies, I very much doubt we would have E5 and E10 gasoline.
Aromatics replaced lead and oxygenates can replace aromatics. Oxygenates have replaced aromatics for example, with methyl tertiary butyl ether (MTBE), ethyl tertiary butyl ether (ETBE) and ethanol. Aromatics continue to be blended in motor gasoline, but over the last decades the proportion of aromatics in the blends has declined.
Polluting chemical plants have been shut down and production outsourced. We should also be mindful of labor legislation that must be respected and can sometimes constrain European competitiveness. Please don’t get me wrong – I am not arguing against the climate or labor practices of the governments in Europe. But all actions have consequences.
What does all that mean for the future of aromatics: while some sectors will use less aromatics, humans still need clothing and plastics in all walks of life, requiring aromatics as a building block!
OPIS: Are there any emerging trends or opportunities within the European petrochemical market that you believe industry players should pay attention to in response to recent plant closures?
Kishore: Perhaps this is also a cliché, but industry players must continue to focus on their strengths. The main advantage that they have over non-European competitors is the high barrier of entry into the EU market. A combination of factors like limited infrastructure, language and cultural barriers and complex, non-uniform VAT regulation adds to the cost of entering the European market.
For example, China is by far the largest global chemical producer (with €2.39 trillion in sales in 2022). But factoring in high freight rates and distance to market makes entry for countries even such as China more challenging.
For the main part, I believe that European producers should continue to protect their customers and make every effort to hold on to their market share. This includes investing in infrastructure that allows access for potentially outsourced production.
OPIS: Considering the forecasted shutdowns and potential future closures, what long-term strategies do you think European petrochemical companies should adopt to navigate these challenges?
Kishore: I do not think European companies are just sitting on their hands and watching their world crumbling around them. They have been taking active steps to improve their competitiveness, whether by adapting their commercial strategies or making technical innovations.
One strategy already adopted by olefin producers is to adapt ethylene plant feed from naphtha to NGLs and set up alternative supply chains. In some cases, crackers have been converted to mixed feed to allow them to take advantage of changing supply/demand dynamics.
Investment in research and innovation has also increased. According to CEFIC data, the EU27 research and innovation spend increased to €11 billion in 2022 from €6.8 billion in 2004. However, as a percentage of added value, it declined to 6% from 8%. So, is that enough, or does there need to be more?
At the risk of repeating myself, I feel that European companies should invest in logistical infrastructure. To give an example, Italy is an importer of benzene but the infrastructure they have makes it very difficult and expensive for the buyers to get supplies from outside the Mediterranean Sea.
OPIS: With the closures of petrochemical plants, what opportunities do you see within the European petrochemical sector?
Kishore: I think there will be more opportunities for companies involved in importing polymers rather than aromatics. This is because some of the aromatic-consuming plants are closing or are at risk of long-term closure. Examples are Trinseo’s styrene monomer plant in Germany, the Indorama PTA site in Portugal and INEOS’ PTA facility in Belgium. We also saw a press release recently from LyondellBasell suggesting that they are reviewing their European assets. Perhaps this includes their propylene oxide/styrene monomer unit in the Netherlands?
Some of these units don’t make polymers directly but contribute raw materials, adding to the polymers made directly from ethylene and propylene.
While these plants are facing closure, the average GDP growth rate of 1.5 to 2% in the EU suggests that demand is growing anyway. So, we need petrochemical derivatives like polymers, fibers, and a host of other materials in the construction and automobile industries as well as for direct personal consumption. The increased requirements of packaging that emerged during the pandemic also continues.
This is not to say that aromatics traders will not have opportunities (especially when there are short-term disruptions), but I feel that we may have seen the peak here. As I spent many years as an aromatics trader it pains me to say these words, and I hope that I will be proven wrong!
OPIS: Given the global energy objectives towards cleaner fuels and renewable alternatives, how do you envision the role of petrochemicals evolving in Europe, and what strategies should companies adopt to stay relevant in this changing landscape?
Kishore: The short answer is that the role of petrochemicals in our daily life is too important and on a wider level, producers will continue to stay relevant and continue adopting increasingly climate friendly practices.
Corporate social responsibility, environmental, social and governance, recycling, circularity and other buzzwords are evolving to keep us politically correct when it comes to discussing the climate impact of the chemical industry. We know that this industry is essential to our daily life, even though some media outlets would make the public believe that the petrochemical industry is only harmful.
The fact is that the world GDP was $101 trillion in 2022, according to World Bank data, and global chemical sales (CEFIC data) in 2022 was $58 billion, so let’s say, 6% of global GDP was contributed to by the chemical industry.
Being green and clean is an objective that’s been fully accepted and adopted by the chemical industry for decades now. Strategies to deal with this are already in place with all chemical producers, which are no doubt continuing to evolve with local, national and global legislation.
I believe that as we continue the move towards a decarbonized world, we may need to look for sources of essential hydrocarbons outside the conventional places that we have been used to. An example is the conversion of a naphtha-based steam cracker to a gas-based feed. This means that products like pyrolysis gas, a feedstock for benzene, butadiene, a feedstock for rubbers, and others may have to be found elsewhere. Increasing the olefins output from about 55% to about 95% will have a knock-on effect on the output of heavier products.
But to insert a dose of skepticism here and the influence of national politics: if nuclear fuel becomes more popular for electricity generation and fossil fuels become more available and cheaper as a result, will there be pressure on the petrochemicals industry to move back to using them for feed? Or to use other sources of energy in other industries?
Witness the dramatic increase in coal consumption in countries like India and China when oil prices moved up leading into and after the conflict in Ukraine. Change is constant, and policies adopted by companies will also continue to change with the times.
OPIS: Is Europe able to handle the changes in trade flows that may be an outcome of shifts in production?
Kishore: Absolutely. But there has to be a change in focus and an openness to alternatives. I have already mentioned the need to invest in infrastructure. In addition, companies will have to consider incentivizing alternate supply sources.
Given price volatility, the need for risk control and hedging strategies will increase. Some companies are further ahead in this area than others. Some others deliberately take risk as a strategy and that allows them to deal with the changes in trade flows. But recently, shipping from new supply sources in Asia has been a challenge due to an increase in shipping costs, a lower availability of vessels and an expectation of forward supply availability. This can lead to price backwardation in destination markets, so a supplier may be reluctant to ship longer distances.
So, while Europe can adapt to the changes in trade flows resulting from shifts in production, it will require strategic investments in infrastructure, incentivizing alternative supply sources, and enhancing risk control and hedging strategies to manage the associated challenges effectively.
OPIS: What kind of companies are most likely to survive the challenges discussed here?
Kishore: Those companies that think outside the box and are not afraid to acknowledge the need for change. “We have always done it like this” is a refrain that I used to hear a lot, but less now than before. This does involve risk, and there is the need to recognize that risk is not a dirty word.
One of the constant features of the petrochemicals market has been its cyclical nature. An up cycle has always followed a down cycle. It looks bleak, but day always follows night, though the nights can sometimes be long. Over the years I have seen Europe in crisis multiple times, and it has always come out of it stronger, albeit looking different from before.
To misquote the American writer Mark Twain, “reports of the death of the European chemical industry are greatly exaggerated.”
Major energy companies are betting on hydrogen as they branch into new renewable ventures and investors are keen to understand the evolving landscape and what role this alternative could play compared to natural gas and electrification.
The present day is seen as a critical juncture for the hydrogen market. To help investors navigate the emerging hydrogen economy, OPIS recently took part in a roundtable of industry experts, exploring factors that could drive wider adoption of hydrogen as a clean fuel source.
As pointed out during the discussions, challenges of developing hydrogen trade include funding assurance for new projects and the ongoing changing landscape of regulation across the European Union and the United Kingdom. Other key material issues that must be addressed involve convincing industrial sectors how they can electrify or switch to hydrogen.
Well-established corporations such as ExxonMobil see the importance of implementing hydrogen for their energy needs, according to the company’s low carbon hydrogen solutions executive Michael Foley. Besides manufacturing experience, leading energy producers aim to develop hydrogen on a wider scale as part of their overall strategy. For many, however, manufacturing it from natural gas with carbon capture remains the most affordable method.
Another point made during the roundtable concerned hydrogen availability and predictability, that is, whether enhanced cooperation amongst parties can translate into realistic demand. Fuel switching, currently gas-fed networks with hydrogen, remains a huge endeavor, and in here coordination remains a key component in the transition toward hydrogen adoption. In that sense, although hydrogen as a fuel can be seen as very similar in practice to natural gas, it still needs to be treated in different ways concerning its safety criteria, storage, and other matters. As such, a full switch of pipelines and use is not as evident as many would expect.
Expectations anyway remain high, points out Cadent’s director of strategy Angela Needle. Current research for instance confirms that standard natural gas networks can safely handle up to 20% of blended-in hydrogen, without having any significant impact on the majority of appliances that would use the blend. Yet the same cannot be said for larger infrastructure levels such as gas turbines, which would in theory require different blend conditions.
Without a doubt, hydrogen is still an essential component to achieve net-zero targets for power industries, and developing business models together with governments will continue to contribute to creating confidence from the user’s side, said Marta Oliveira of Ikigari Capital.
Incentivizing Hydrogen Investors
From a venture capital perspective, project developers need to look at hydrogen in terms of multi-modal transport demand to push for expansion. Investors need to see more material demand for hydrogen production, and this will help create the infrastructure, testing, and confidence in production. Still, investors need more visibility on potential revenues, for if the issues surrounding establishing and maintaining demand for hydrogen can be resolved, other cost-side challenges can be addressed more quickly.
OPIS produces a hydrogen cost price index that underlines such cost-side challenges. The index reveals that green hydrogen in the Netherlands, Germany and the UK has consistently been more expensive than its chief competitor, natural gas, which hydrogen makers hope will be swapped for the greener gas in industrial processes.
The May OPIS Netherlands green hydrogen price stood a whopping €156.61/MWh more expensive than the equivalent EEX Dutch TTF natural gas price. This compares with €155/MWh in the previous month.
With greater market assurance, there will also be more consistent hydrogen pricing. Producers would eventually manage to trade hydrogen in the same way as other energy commodities.
A key takeaway from the discussion showcases the differences between the EU and U.K. hydrogen prices when reviewing the implementation of industry production requirements. The Hydrogen Bank Allocation program, which entailed direct subsidies intending to incentivize green hydrogen projects, has benefited in curtailing hydrogen production prices for EU-based initiatives. The U.K. Hydrogen Funding rounds display higher prices than their continental counterparts, making them in turn less attractive projects to take up.
Nonetheless, all specialists emphasized the importance of establishing common policies, to encourage investment for scaling up production. New requirements for carbon capture and storage are contributing to creating demand for alternative fuels by a diverse range of industrial sectors. This in turn will facilitate the setting up of business models to support hydrogen pipelines and storage facilities enabling the massification of green hydrogen consumption for Europe’s industrial needs.
Watch our latest on-demand webinar in partnership with Investors Business Daily,
‘Why 2024 Is A Pivotal Year For The Hydrogen Market: A Conversation With IBD And OPIS’

Carbon costs in Asia Pacific countries have remained subdued due to the generous allocation of free allowances, ultimately limiting the effectiveness of the emissions trading schemes (ETS) in driving emissions reduction efforts.
Exemplifying this trend, over the past year, South Korean Allowance Unit (KAU23) prices have dropped below those of China Emission Allowances (CEA), to become the weakest among key emissions trading schemes in the region. Similarly, New Zealand’s emissions prices have fallen by over 26% over the past six months.
Both South Korea and New Zealand face oversupply issues, exacerbated by rigid multi-year ETS planning approaches and the challenge of absorbing oversupplied units into the market.
In this blog post, we will unravel the challenges and trends shaping the region’s emissions markets.
South Korea Emissions Trading: Price Decline Persists
The South Korea Emissions Trading System (ETS) is experiencing a significant bearish trend, largely due to an oversupply of allowances for the third planning period (2021-2025).
Prices have significantly decreased, from an average of KRW 21,436/mt (US$15.61/mt) in 2022 to KRW 8,825/mt (US$6.43/mt) in mid-May 2024, according to Korea Exchange and OPIS data.
Typically, KAU prices peak at the start of each compliance cycle and gradually decline as market demand absorbs the surplus. However, these peaks have been starting progressively lower each year since the commencement of the third period.

In 2023, the Korean ETS faced an oversupply of 10.7 million mt of KAU22, compounded by a borrowing of 0.7 million mt from 2023 and a carried-over volume from 2022 of 39.2 million mt. The industrial sector, the largest emitter and net-seller, was allocated a surplus of 23.4 million mt units, contrasting with the 12.3 million mt shortfall from power entities, according to data from the Greenhouse Gas Inventory and Research Center of Korea. Considering the 2023 figures, the industrial sector made a net sale of 15.2 million mt, leaving them with a surplus of 8.2 million mt that could potentially be carried over to the current cycle as KAU23.
While power entities might need to purchase additional allowances to meet their demand shortfall, the overall supply surplus means they can afford to wait. Additionally, sectors with surplus quotas tend to sell their free quotas whenever the prices are favorable, market sources said.
Starting in 2024, the authority introduced a more lenient carryover rule for KAUs, allowing surplus entities to roll over quotas up to three times the net amount of emissions permits they sell annually. Despite aiming to deter selloffs as the compliance deadline approaches, this measure may have limited effectiveness in curbing the decline in prices, merely slowing its descent, sources said.
OPIS assessed the price of KAU23 at KRW 8,910/mt (US$6.54/mt) on May 19, and market sources said that there is still potential for further decline, with the auction price floor set at KRW 6,900 (US$5.07/mt) and the upside possibly reaching around KRW 10,000/mt (US$7.34/mt). However, due to the low level of liquidity and the limited number of active market participants, prices could fluctuate significantly. Market makers that include financial firms and brokers, in particular, could further influence the price movements as they seek to optimize their financial positions frequently, sources added.
According to a market source, the bearish sentiment could persist until the end of the third quarter with some potential for recovery in the final quarter, aligning with observed patterns from past compliance years.
New Zealand ETS: Policy Uncertainty Intensifies Price Pressure
The outlook for New Zealand Units (NZUs) remains dependent on whether concrete reforms are implemented to resolve fundamental market imbalances.
The NZU prices witnessed a general decline, marked by two distinct nosedives, during the first half of the year, plummeting over 30% from the year’s onset due to concerns about oversupply and policy uncertainty.

The initial decline occurred in late March, following a partially cleared auction that signaled weak demand. This was particularly notable after all four auctions were canceled last year, resulting in the removal of 23 million NZUs from reserves. Despite this, trading volume peaked in March, with nearly 1,000 transactions recorded for the month, according to official data. Transactions surged by 44% between January and April compared to the same period last year, attributed possibly to speculative activities, as actual compliance remained limited, market sources said.
The NZU market experienced another significant price drop in late May, reaching a near ten-month low of NZ$45.23/mt (US$27.61/mt) on May 20, according to OPIS price assessments. This plunge followed the government’s proposal to lower auction volume as well as the auction price floor starting next year. The move stirred frustration and increased policy doubts among market participants due to a perceived lack of clarity and rationale behind lowering the price control settings.
Amidst the policy uncertainties driving recent declines, some market participants expressed caution, highlighting that fundamental oversupply and weak demand could pose a more substantial price risk. Moreover, selling pressure from farm forestry participants facing lower margins and rising on-farm costs could intensify the situation.
New Zealand’s independent statutory agency Climate Change Commission (CCC) said that the oversupply, estimated at 68 million units at the end of September 2023, was a risk to meeting the country’s climate goals. The government is seeking to alleviate that risk by reducing auction volumes from 2025 onwards.
With recent NZUs trading well below the NZ$64/mt (US$39.02/mt) minimum price required for the government to sell units at auction, expectations for the remaining 2024 auctions are subdued, which could provide an upside in the longer term, sources said.
“If we get back into a series of failing auctions, then that will actually be positive for the long run as we will likely end up like last year with that volume simply vanishing and not being offered next year,” a trader said.
Other potential price supports include major policy changes aimed at limiting forestry supply entering the market, such as implementing caps or amending the Resource Management Act to restrict the amount of land available for forestry units. However, the realization of those measures may be some time away, sources told OPIS.
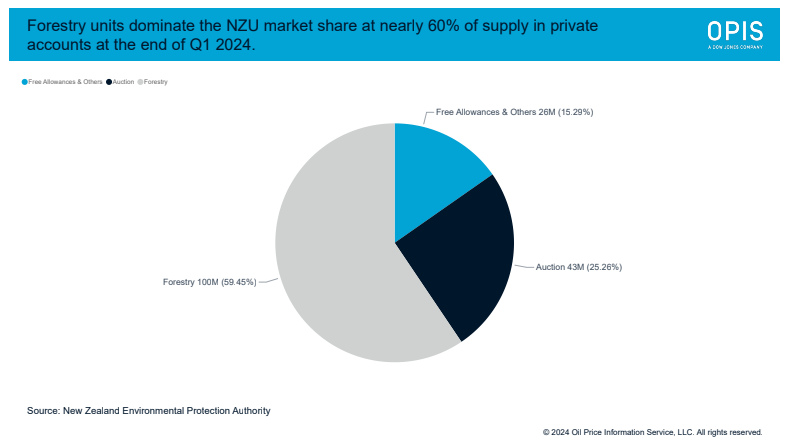
Forestry credits constitute one of New Zealand’s three primary sources of NZU supply, alongside free allocation and auctions, contributing around 60% or 100 million units held in privately owned accounts as of the end of March. Free allowances and others and auctions meanwhile account for around 26 million mt and 43 million mt, respectively.
Between now and next year, market sources are anticipating continued speculation and volatility with the government expected by the end of September to announce decisions around the key ETS settings for 2025-2029.
Key Developments Unfolding in APAC for Emissions Trading
In the broader region, governments are expanding their respective carbon trading schemes while carefully considering potential oversupply.
Australia, for instance, is prioritizing the development of stricter methods under its voluntary Australian Carbon Credit Unit (ACCU) scheme to address a looming supply gap caused by the expiry of two land-based methods. This comes in anticipation of increased demand from entities covered under the Safeguard Mechanism, which will face tighter emissions baselines starting next year. Prices for the ACCU Generic, the most commonly traded units, have been held relatively flat averaging A$35/mt (US$23.37/mt) over the past four months, according to OPIS price assessments.
Meanwhile, China aims to tighten allocation for the current compliance cycle to align with stricter industry benchmarks, including revising and reclaiming overallocated units from the previous cycle. Expectations around policy changes drove China Emissions Allowances (CEA) prices to an all-time high at 103.47 yuan/mt (US$14.44/mt) on April 29. Additionally, new sectors such as aluminum smelting and cement are generally expected to be incorporated into the ETS in the upcoming compliance cycle covering emissions in 2024-2025.

($1 = KRW 1,362, AUD 1.50, NZD 1.64,CNY 7.16)
May can be a Jekyll and Hyde type of month when it comes to gross rack-to-retail margins, but the 2024 rendition is certainly the version that downstream marketers would like to see on a regular basis.
 Based on the latest OPIS data, the average gross margin for the month of May came in at 45.9 cents per gallon. The May average margin was the strongest one-month average since November 2023 and it was easily the strongest May on record, as no other May has come close. Over the past 10 years (including 2024) the average margin for May was around 26.5 cents per gallon.
Although June is just getting started, the early returns for margins show a similar trajectory for this month, though that can change quickly, considering the volatility in markets.
The month of May certainly experienced some volatility in the average gross margin, but it was from a higher level. During the month, the daily U.S. gross margin averaged anywhere from a low of 33.4 cents per gallon at mid-month, and the high of 53.8 cents came on the last day of May.
 Gasoline futures markets, as well as several spot markets, made the strong margins somewhat easy to predict.
The highest gasoline futures settlement of May was on the 2nd at $2.5965 per gallon, but by May 30th the futures market had tumbled by more than 19 cents per gallon, settling at $2.4046 per gallon.
Futures markets only tell part of the story that contributed to a strong gross margin environment as spot prices in several markets exceeded the decline seen on the paper side.
 At the beginning of May, Los Angeles CARBOB was pricing around $2.825 per gallon, with San Francisco at $3.015 per gallon, OPIS spot market data shows. But by the end of the month, L.A. gasoline was almost 40 cents cheaper at $2.4275 per gallon with San Francisco more than 50 cents cheaper ending the month at $2.4975 per gallon.
That move, as you may have guessed, supercharged margins throughout the month. The California average gross margin started May at 73.2 cents but ended just shy of 92 cents, with the average gross margin about 6 cents below the highs at 86.2 cents.
A strong margin environment is necessary to make up for lost gallons as same-store sales are down compared to the previous year, based on OPIS monthly gasoline demand data.
With the summer driving season officially underway, retailers will be looking for some positives, and there are some if you happen to be a “glass half full” person.
2024 started the year with very soft gasoline demand, with January running almost 7% below January 2023. However, January is typically the softest month of the year when it comes to gasoline consumption. Since January, the deficits to 2023 have been narrowing.
 Though month-to-month volumes are getting some traction, same-store sales versus 2023 are still looking soft. Final May gasoline demand was about 4.2% below May 2023, but if you are looking for the positive, the year-on-year trend is narrowing as the month of May saw the smallest loss in volume compared to a year ago. In fact, May was the smallest year-on-year loss since August 2023.
The monthly improvements are seen in most individual regions.
The heavily populated Northeast region has been consistent in its declines versus 2023 over the past three months with year-on-year declines in the 4.6-4.8% range versus 2023. While the Northeast sees the steady demand drops versus a year ago, the Mid-Continent sees a bit wider same-store sales losses on either side of 5% down.
Southwest is turning in the strongest demand with May running just 2.4% behind 2023. Other than in January when weather was poor, Southwest gasoline demand saw the largest demand destruction, but over the past 12 months, the Southwest has been in striking distance of year-ago levels.
While most point to sliding gasoline demand on the West Coast, the Pacific Coast region performed admirably in May falling 4.2% versus last year.
Based on the latest OPIS data, on a year-to-date basis same store sales are down by 5.3%. Individual regions range anywhere from down 3% to down just over 6%.
Year-on-year market share in May 2024 saw mostly minor shifts between branded and unbranded stations with unbranded stations in the U.S. grabbing a bit more market share against the branded outlets and perhaps to a lesser extent some of the big box retailers thanks to relatively calm retail gasoline prices.
 During May 2024, unbranded stations in the U.S. garnered 56.09% of the market, compared with 55.58% during the same month a year ago. Meanwhile, branded market share slipped from 44.23% in 2023 to 43.69% in the recently completed month.
Although some of the big box retailers did see a bit of market share erosion, those, along with some of the grocery chains, remained some of the most efficient sites in the U.S., selling quite a bit of fuel considering much lower station counts than the brands and some of the large regional chains.
Buc-ees, Costco and Sams Club had the highest efficiency ratings, according to OPIS AnalyticsPro data, but in all three cases, efficiency was down nominally from a year ago H-E-B, Wal-Mart and BJ’s all saw efficiency gains, but even with efficiency figures north of 6, they are still about one-third that of Buc-ees. Kroger, Ingles, Frys and Fred Meyer rounded out the top 10 in efficiency in May.
 Costco maintains its spot as the most aggressive when it comes to pricing, as the average Costco price was 32.9 cents below the local average, which is just over 2 cents more of a discount than last May. One of the bigger movers in average price discounts versus the local average was California-based Flyers. There are 23 brands in the OPIS database priced 25 cents below the local average, increasing the discount from last year by 18 cents.
With May 2024 priced several cents higher than May 2023, big box retailers and some chains used it as an opportunity to become more aggressive on street price.
The need for the global adoption of renewable liquified petroleum gas (LPG) is becoming increasingly apparent, as the fuel may offer the transitional qualities needed as the world looks to decarbonize. This was one of the biggest takeaways from the Gaseous Fuels Forum in Warsaw in May 2024.
The key to making renewable LPG a success in the future is framework and legislation, for which Liquid Gas Europe is advocating, with general manager Ewa Abramiuk-Lété stating that now is the time to promote renewable LPG and bioLPG into law.
BioLPG is produced from renewable sources, including biological oil and fats, and the fermentation of glucose by microorganisms, with an even lower carbon footprint than conventional LPG.
Some countries in Europe have already adopted renewable LPG into their national energy plans—Spain, Italy and Czechia, where bioLPG is part of subsidy packages—and it is hoped others may follow, according to Abramiuk-Lété.
Dimethyl ether (C2 H6O)—known as DME, used extensively in industry worldwide, is a colorless gas that is chemically similar to butane and propane and like LPG, it is easy to handle and store in liquid form. However, Renewable Dimethyl Ether (rDME) is specifically produced from renewable feedstocks, such as methane from agricultural and municipal waste, renewable power and CO2, meaning that carbon emissions are substantially reduced, by up to 85%.
There are many alternative fuels on offer. Biogas to bioLPG product is an increasingly popular pathway, as well as using Renewable Dimethyl Ether (RDME) for blending with LPG. BioLPG is a viable solution to address green fuel targets across Europe, and although currently at low levels, production quantities are increasing.
Global renewable LPG production capacity has risen steadily in recent years and is now around 200,000-250,000 metric tons/year. And if all planned projects come to the market, bioLPG production could reach around 625,000 mt/year by 2025, Abramiuk-Lété noted.
Renewable liquid gases, such as bioLPG and renewable and recycled carbon DME bring even greater climate benefits than that of conventional LPG.
On a cost level, RDME can be blended with propane at up to 20% by weight without major infrastructure changes, according to Oberon Fuels chief executive and president Dr. Rebecca Boudreaux. When blended with propane, the fuel offers a potential greenhouse gas reduction of up to 60%, Boudreaux added.
Renewables producer Oberon Fuels is continuing to ramp up its expansion plans in the RDME sector. The firm is expected to announce a final investment decision on a proposed Texas-based RDME production facility later in 2024. This would be its second plant in the U.S., following the start of production at a facility in Brawley, southern California, in 2021. In Europe, Oberon Fuels announced in March 2023 that it would partner with Ireland’s DCC Energy to design and build RDME production plants in the region.
RDME can be made from a range of feedstocks including forest and agricultural residues and animal manure, and can create wider revenue streams, Boudreaux said. Additionally, because of the molecular structure of DME, there are opportunities for propane companies to play a role in the growing hydrogen economy. DME is a clean, cost-effective way of transporting hydrogen, given it is easy to deploy and not dependent on pipeline and a grid, Boudreaux added.
There are also opportunities for growth in the conventional LPG sector. The World Liquid Gas Association (WLPGA) identified the several growth areas including the autogas, marine, domestic and industrial sectors.
LPG serves around 3 billion people worldwide, nearly half the global population, but for the remainder, access and infrastructure needs consideration, which is a widespread issue in the developing world, WLPGA deputy managing director Michael Kelly said in his presentation at the Gaseous Fuels Forum.
LPG is often the first fuel people turn to when cooking as an alternative to wood, biomass and charcoal. It is a popular choice because it is flexible and it can be easily transported. The fuel can ensure no community is left behind amid the energy transition.
In many countries, the domestic electricity grid simply doesn’t reach enough people and is not reliable, according to Kelly. That can have a huge impact on the economy and quality of life in such countries. For example, when demand for electricity exceeds the available supply in parts of South Africa, planned supply interruptions may have to be carried out, referred to as load shedding. In these instances, LPG can offer an excellent alternative for power supply systems, large or small, said Kelly.
There are around 49.2 million rural households in the EU and most of them are not connected to a gas grid, data from Liquid Gas Europe showed. These buildings will typically use fossil fuels for heating.
LPG will continue to play a key role in reducing carbon dioxide emissions and the energy transition across multiple platforms – for heating, industrial, marine or even domestic use.
Liquid Gas Europe are currently lobbying to convince policymakers and stakeholders that LPG is an excellent fuel for the energy transition. Governments became really excited at the prospect of electric vehicles, but it turns out they aren’t the only solution to reducing emissions, Kelly added.
“The transition from petrol and diesel to electric is going to take longer than people think, and it isn’t going to be achieved in the next two to three years. Therefore, we need alternatives and LPG is a great one. I’m not saying in 30 years we won’t all be driving electric vehicles but before we get to that point, we need transitional fuels,” Kelly told delegates.
The autogas sector continued to be Poland’s largest recipient and user of LPG—making up 75.6% of the total Polish LPG market, according to the 2023 report from LPG association Polska Organizacja Gazu Ptynnego (POGP). But the actual percentage LPG accounts for in the Polish autogas sector is relatively small—13.6% – compared to diesel and petrol, which make up 32.8% and 53.5%, respectively, POGP data showed.
Another sector that has received a lot of interest and development over the past few years is the marine industry. Since the International Maritime Organisation reduced the limit of sulfur content in marine fuels to 0.5% from 3.5%, LPG has emerged as a potential alternative shipping fuel.
“We are starting to see more carriers propelled by LPG, given it is a cleaner fuel than fuel oil as well as reducing costs and conforms with most standards and regulations,” said Kelly. “There is also a great opportunity for the smaller coastal fleets, and this is an area we are looking at significantly expanding, after being successful, at least initially, on the larger carriers.”
Post-December Concerns in Poland
Sanctions on Russian LPG imports in the European Union and what will happen after Dec. 20, 2024, was another hot topic discussed widely during the conference.
The EU announced its latest slew of sanctions against Russia on Dec. 19, 2023, which included measures to ban LPG imports with a 12-month transition period. There is a stay of execution until Dec. 20, 2024, for contracts concluded before Dec. 19, 2023.
Russian LPG used to make up around 75% of the total flow to Poland, but this has eased, dipping to around 49% in 2023. So, the question is, where is Poland going to source 49% of its total LPG imports when it can no longer seek out Russian flows? The answer comes by looking further afield, but that comes with cost implications.
There are four main seaborne LPG terminals in Poland: Police, Szczecin, Gdansk and Gdynia. However, their combined capacity is not enough to cover the total seaborne flows needed to make up for the ending of Russian LPG trade, consultancy Information Market (IM) said in its presentation.
Gdansk was the most active port in Poland for handling LPG in 2023, making up around 56%, according to data from trader SHV Energy. Gdynia and Szczecin made up the remainder, 25% and 19%, respectively.
Meanwhile, Polish demand for LPG sourced from Sweden has risen by 20% over the past two years, IM added.
On the rail network, Poland will need to rely on supplies by train from the West to make up for the shortfall. Poland imported around 1.1 million mt/year from Russia via rail last year, according to consultancy A-95.
However, early indications are that relying on the rail network might not be viable, following concerns over logistical problems reported in Germany that have caused delays and bottlenecking, IM noted.
IM suggested Poland could take advantage of flows coming from Germany and the Amsterdam-Rotterdam-Antwerp trading hub to the eastern terminals via rail links, but it also pointed to countries in the East, other than Russia, from which Poland could import.
One of these was Kazakhstan, a country from which Poland has imported LPG in the past and could still do so again. Poland imported around 8,000 mt of LPG from Kazakhstan in 2023, and 35,000 mt in 2022, according to data from trade analytics firm Global Trade Tracker (GTT). From the Baltics, Poland imported around 26,000 mt from Lithuania and 13,000 mt Latvia last year, up from 25,000 mt and 4,000 mt, respectively, in 2022, GTT data showed.
Looking ahead, a post-December Poland is going to be more reliant on seaborne flows than it ever has been and there are many challenges ahead. But there are also many opportunities for the Polish market, one of which is ramping up renewable LPG output using local feedstocks. By utilizing its natural resources, Poland can create renewable products such as RDME, methanol and hydrogen to embrace energy independence and reduce greenhouse gas emissions.
As the lizards of Transylvania roam its incomparably beautiful grasslands, they are blissfully unaware that a lot of money and human hopes rest on their thin little shoulders. They also do not know that their homes are in grave danger.

Lizards have quite the life in Târnava Mare, in the southeast corner of the region, thanks to its incredible biodiversity spread over endless vistas of meadows, gentle hills and forests.
Their grassland habitats are in danger because of changing land use, the same principal cause of global biodiversity loss. The land is very fertile, making it ideal for big agricultural companies to buy at a time when farmers in the region are aging and their incomes are in the low thousands of euros.
Târnava Mare is consequently under pressure, losing more than 5% of its grasslands to arable farming in just the last few years, says local charity Adept, with satellite images suggesting that 25% of the entirety of the nearby Hârtibaciu basin, more easily accessible by road, has already been turned over to arable farming. It all portends disaster for the area’s biodiversity.
Saving Transylvania’s Grasslands with Biodiversity Credits
Georgiana Păun, a 30-year-old Romanian herpetologist and lizard expert, demonstrated her ability to spot and record more than 60 of the creatures during an OPIS site visit last summer. “I am a lizard,” she explained. This put her at the forefront of a bold new project that aims to measure the biodiversity of the grasslands, preserve them and then create voluntary biodiversity credits. Those credits might then be sold on by an investor willing to fund the initial conservation work.
Developed by Adept and British ecological restoration company rePLANET, the Târnava Mare project is one of the first biodiversity credit projects to use an “uplift” methodology that can in theory be applied to ecosystems around the world requiring restoration or preservation.
The methodology works by cataloguing the abundance of several “indicator species groups” that reflect the wider biodiversity of an area.
In the case of nature restoration projects using the methodology, voluntary biodiversity credits are then issued once an intervention to boost nature has resulted in a measured increase in the median abundance of those indicator species groups, with measurements of uplift taking place at a maximum of five-year intervals.
One biodiversity credit represents a 1% uplift in the median abundance of the indicator species in a hectare of a project. “Additionality” is baked into credit issuance: if there is no measured uplift in median species abundance in the wake of an intervention, no credits are generated.
In the case of “avoided loss” biodiversity credit projects such as Târnava Mare, the baseline is created by measuring biodiversity in areas that have already been ploughed, with very harmful effects for the indicator species.
The difference between the biodiversity found in those baseline reference sites and the biodiversity measured every five years in the conserved grasslands then forms the basis of biodiversity credit issuance over the 40-year lifetime of the project. If biodiversity measurements take place every five years and show that the project area’s biodiversity is being conserved, credits will be issued in five-year increments.
The methodology’s proponents say that the 1% uplift per hectare methodology creates a unit of quantification that is comparable to the metric ton of carbon that is used to generate carbon credits and allowances.
From Conference Hype to Hard Yards
In the year and a half since COP15 negotiations between 190 nations brokering the Global Biodiversity Framework in Montreal, there have been dozens of typically well-attended conferences about biodiversity credits. Such summits have been more numerous than projects actually capable of generating voluntary biodiversity credits.
That is beginning to change, and the Târnava Mare scheme, the most advanced of the rePLANET-affiliated projects, has now completed its base-lining work, which has been submitted for verification to the Biodiversity Futures Initiative, a non-profit peer reviewer employing academics.
The level of effort involved in collecting that indicator species data becomes quickly apparent during the OPIS site visit to the 2,219-hectare project area in Târnava Mare, as does the gulf in biodiversity between the conserved and razed grasslands.
Several Romanian and British ecologists, in addition to a Romanian support team recruited by Adept and rePLANET, spent two months in the summer of 2023 in Angofa, a wildlife center housed in a small former 19th century village schoolhouse a few miles from the castle town of Sighișoara, a potential birthplace of Vlad the Impaler, the inspiration for Dracula.
The data collection was overseen by 34-year-old Dr. Max Bodmer, a coral reef expert and former teacher, who verified Păun’s lizard observations over several hours of trekking in the heat between different sites.
Biodiversity and Beauty in Transylvania
Târnava Mare’s ability to beguile lies in the contrasts it serves up with every bend of the road. “Welcome to hobbit land,” says Păun as the car passes soft-sloping green hills that crest into the far distance to the left, while mighty oaks, some of Europe’s oldest, loom to the right. But the car turns a corner, and the hills suddenly give way to cloud-capped mountains, which soar above one of the region’s fifteen valleys carpeted with thick forest.
 The beauty and biodiversity contained in Transylvania and its threatened grasslands have attracted visitors, writers and royalty through the ages. During a late-afternoon break from lizard spotting, Bodmer’s mud-caked car is passed by King Charles III as he exits a 12th century fortified church in the village of Viscri. Britain’s Transylvania-loving king has a home in the village and has previously lauded the region’s “priceless biodiversity [and] remarkable examples of sustainable farming.”
Nat Page, a former British diplomat and the director of Adept, employed ecologists in 2009 to measure the biodiversity of the Târnava Mare grasslands, and their study showed some of the highest concentrations of plant species ever recorded, with 45 species identified in a 0.1 square meter space.
“It really is incredible when you’re walking through the grasslands in the Târnava Mare. With every step you take, you’re seeing something new,” says Bodmer, who hopes that the project can serve as a template for restoring biodiversity in his native Britain. “It really can be used as a model for what a European grassland and what a European agricultural landscape could look like if we start to manage land more effectively and with more care for biodiversity in the natural environment,” he argues.
It is a shock, then, when Păun and Bodmer finally reach one of the sites that appeared to be home to pristine grassland, only to find that it has been ploughed up in the two days between being observed via satellite images and the pair’s arrival at the site.
Gone are the all-you-can-eat grasshopper food bars, the butterflies of every hue and the hares jumping out of the grass, with the lizards hit the hardest. The data collected by Păun show that lizard sightings in the conserved grasslands are more than 20 times higher than in the ploughed areas, some of which are not being actively managed but are already in the process of being converted for arable farming.
Boosting Farmer Incomes Key to Saving Biodiversity
Preserving a large part of the grasslands in the medium-to-long-term will depend on finding cold, hard cash to combat the lure of big agrifood money and the region’s stark demographic challenges.
Large parts of Romania have all the trappings of modern European life, but high in the Transylvanian hills, a few villagers still travel by horse and cart along often decrepit roads in half-abandoned villages.
If a corporate buyer of the project’s biodiversity and carbon credits can be attracted, a viable future in farming is still possible, say rePLANET and Adept. The all-in costs for the 40-year-long project come to $17,560,000, with the estimated biodiversity credits slightly more numerous than carbon credits (the exact prices are featured in the OPIS Biodiversity Market Report, published for the first time this month).
Around 115 small-scale farmers would receive direct payments representing 60% of the project’s funds if they pledge to maintain and boost traditional biodiversity-friendly farming practices, greatly improving their livelihoods. Under current arrangements, according to rePLANET’s calculations, a farmer owning five cows, 15 sheep, nine hectares of hay meadow and 12 hectares of pasture can expect a net annual income of €3,150 ($3,400), which includes recently reduced EU Common Agricultural Policy payments.
Funding from the credits would boost net income to €5,800. Furthermore, if the credits were resold by the project backer, 60% of any profit would go back to the project participants. The biodiversity-carbon credit project would consequently tilt the balance in favor of preserving the all-important traditional farming practices, say rePLANET and Adept.
The latter has discussed the proposal with local community mayors, but the early-stage nature of the project means that the developers do not want to get farmers’ hopes up before a backer is found.
A lot is riding on whether the project receives funding and biodiversity crediting takes off, says Adept’s Page. The former diplomat is critical of how Romanian government payments are being reduced at the same time as payment schemes’ requirements are changing.
“The ability of farmers to access payments is going to fall massively,” says Page. “In 2024, there is no longer a high nature value scheme. It is a massive threat to the area. … New conditions are being attached which would forbid farmers from receiving money unless they leave their land alone until August 1 every year.” That stipulation is at odds with traditional mowing practices, which have taken place at different times of the year, contributing to the region’s biodiversity over centuries.
“The biodiversity and carbon credit proposal is coming at a key moment,” he suggests. “If we can offer sensible, ecologically-literate payment and inspection, rather than bureaucratic Bucharest-based payment and inspection … it’s better than state payments. The power of corporate money to influence the area is even greater.”
Conclusion: Pressure Growing for Corporate Action
The natural world is melting into thin air at a greater rate than human history has ever known. Accounting firm Deloitte warned last month of “a catastrophic future if this depletion persists.” Its report focused on nature-related risks for the U.S. banking system running into the trillions of dollars, and it is indeed the global banking system that is a focus of the Taskforce on Nature-Related Financial Disclosures that was published in 2023.
The market-led, government-supported TNFD is shaping up to be a key driver of corporate action to stem biodiversity loss. A total of 320 early adopters, mainly banks and asset managers, have agreed to use the TNFD framework to assess and disclose the impact of their investments and lending on the natural world.
Such impact assessments and biodiversity footprinting must take place first before companies can undertake actions potentially enabling them to make “nature positive” claims. Voluntary biodiversity credits could offer companies a means to quantify their positive impacts on biodiversity after offsetting the direct impact of their operations on nature.
But a lot must happen to reach that point, including a broader acceptance that “pricing the priceless” and putting a value on nature restoration is necessary and achievable, even as other means to stop nature loss such as legislation and ending nature-harming subsidies are also pursued by governments.
There will also be a time lag between nature restoration project developers undertaking their interventions and actually generating the biodiversity uplift that allows credits to be issued.
It remains to be seen whether a sufficient number of big businesses can be chivvied into making “nature positive” commitments that they then buy voluntary biodiversity credits. Dorothée Herr, then a senior associate at NatureFinance, suggested last year that scaling up biodiversity markets might require “policy-induced demand.”
As the Târnava Mare grasslands project shows, threats are lapping at the edges of even the most widely recognized homes of pristine biodiversity. Credit methodologies to put a rope around them and restore nature to barren ground now exist, as do the ecologists willing to get the projects started.
Plastic. It’s ubiquitous in our lives, from food packaging to medical equipment. However, its convenience comes at an environmental cost: plastic pollution is threatening our oceans and ecosystems. This month, representatives from nearly 200 countries convene in Ottawa, Canada, for a critical moment – negotiations on a global treaty aimed at curbing plastic pollution by the end of 2024. One of the most contentious issues on the table? Plastic production cuts. Let’s explore the key points of this debate.
The Plastic Pollution Challenge
A 2022 report by the Organization for Economic Co-operation and Development (OECD) revealed a concerning trend: plastic waste volume has more than doubled since 2000, with only 9% being recycled. The situation is projected to worsen, with plastic waste expected to reach a staggering 1 billion metric tons by 2060. Our oceans are particularly impacted, accumulating millions of tons of plastic annually. Microplastics, tiny plastic fragments, have been detected everywhere from the deepest trenches to human bodies, raising concerns about potential health risks.
The Push for Production Cuts
Environmental groups and a growing number of governments advocate for significant reductions in plastic production. They argue that this is essential to stem the tide of plastic waste overflowing landfills and polluting our natural world. A recent Greenpeace survey supports this view, with 82% of respondents worldwide backing production cuts as a means to tackle plastic pollution.
Industry Concerns
The plastics industry is strongly opposed to production cuts. They argue that such measures would stifle innovation in developing new, more sustainable plastics. Additionally, they raise concerns about the potential impact on developing nations that rely heavily on plastic packaging for essential goods.
The Plastics Industry Association, a Washington-based group representing the US plastics supply chain, issued a statement advocating for a “circular economy” where even controlled plastic waste is valued for its potential uses. They believe a focus on circularity would be more successful than production limitations.
Chemical Market Analytics by OPIS echoed this sentiment, highlighting a recent letter from the American Chemistry Council to President Biden outlining the need for a successful global plastics agreement that prioritizes circularity while acknowledging the benefits of plastics in achieving a lower-carbon future.
Potential Consequences of Production Cuts
Industry representatives warn that drastic production cuts could have unintended consequences. Nick Vafiadis, vice president of global plastics, at Chemical Market Analytics, expressed concern that such cuts would disproportionately impact developing nations struggling to provide adequate quantities of safe food, water, and critical medical supplies, as plastic packaging offers a cost-effective way to reduce spoilage.
“Draconian cuts to plastic production would have significant unintended adverse consequences to people all over the world. The impact would be most harsh on developing nations struggling to provide adequate quantities of safe food, water, and critical medical supplies to their population as plastic packaging provides a low cost and highly effective method of reducing food spoilage. Those least able to afford the increased costs of essential products produced with alternative materials would suffer most.”
However, Vafiadis also acknowledged positive developments within the industry. Plastics production in Canada is being adjusted to minimize environmental impact, and Dow’s recent announcement of a net-zero carbon emission ethylene and polyethylene production facility in Canada is a promising step.
Finding Common Ground
The debate over production cuts is likely to be heated, but there’s a growing recognition of the need for collaboration. A successful global treaty will likely require a multi-pronged approach:
- Production Reductions: The extent of production cuts, if any, could be a major point of negotiation. Finding a compromise that addresses environmental concerns while minimizing economic disruption will be crucial.
- Investing in Recycling: Building robust recycling infrastructure and technologies is essential to creating a circular economy for plastics.
- Product Design Revolution: Encouraging the design of easily recyclable or biodegradable plastics can significantly reduce plastic waste.
A Turning Point for Plastic?
The upcoming negotiations in Ottawa represent a critical juncture. The outcome will determine the future of plastics. Can the industry adapt and embrace sustainable practices? Can a global agreement be reached that protects the environment without crippling essential industries? The next few months will be telling. One thing is certain: the way we produce, use, and dispose of plastics is on the cusp of a major transformation.
Germany’s approach to achieving climate neutrality by 2045 includes various strategies to mitigate climate impact, but the country’s ambitious move towards hydrogen mobility stands out.
The recent update to Germany’s National Hydrogen Strategy (NHS) lays a framework for integrating hydrogen technology across various modes of transport, including road, air and sea. This multi-faceted approach aims to significantly reduce the transport sector’s carbon footprint, leveraging hydrogen’s potential as a clean energy carrier.
Camila Tubella, green hydrogen project developer at Pacifico Energy Partners, said at a recent webinar: “In Germany, there is a lot of readiness to use hydrogen in mobility.”
One of the central components of Germany’s hydrogen mobility strategy is the development of a nationwide hydrogen refueling infrastructure, an initiative many other European countries are wary of as hydrogen’s low volumetric energy density puts it at a disadvantage to diesel. In the UK, energy major Shell opened three hydrogen filling stations between 2017 and 2019, but by 2022 the company had taken a decision to close them all down.
This German hydrogen endeavor is supported by the long-standing National Innovation Programme for Hydrogen and Fuel Cell Technology (NIP), an early adopter of hydrogen mobility in the continent, which started off with a sizeable budget of €1.4 billion ($1.5 billion). The National Organisation for Hydrogen and Fuel Cell Technology (NOW) runs this ambitious scheme.
HySteelStore, one such project funded by the NIP, aims to solve the difficult integration of a hydrogen tank into a passenger vehicle. Heavy trucks are more suited to being fitted with a hydrogen tank.
The HySteelStore project’s modular steel tank system, designed for integration into future battery electric vehicle (BEV) platforms with underbody battery modules, aims to offer better geometric flexibility, cost-effectiveness, and sustainability compared to Carbon Fiber Reinforced Polymer (CFRP) tanks. This is an example of an innovation that could make a difference in passenger vehicle hydrogen mobility.
Moreover, Germany is making investments in the overall innovation and development of hydrogen technologies. The establishment of the German National Hydrogen Council (Nationaler Wasserstoffrat) early on is a testament to the country’s dedication to supporting research and innovation in the field, much needed in the nascent development of hydrogen fuel cells.
However, transitioning to hydrogen-powered transport is riddled with challenges, including the high initial costs of hydrogen technology and security of green hydrogen supply.
Recent difficulties also included the sacking of a key government official in February in the wake of a nepotism scandal. Consequently, the German transport ministry has put a temporary freeze on the approval of new hydrogen-related funding initiatives.
But other sources of funding for hydrogen continue. The European Commission has approved a €2.2 billion German scheme to support the electrification and decarbonization of industrial processes, including investments enabling the substitution of fossil fuels with renewable hydrogen or renewable hydrogen-derived fuels, to foster the transition to a net-zero economy. The aid will take the form of direct grants, it will not exceed €200 million per beneficiary and will be granted no later than Dec. 31, 2025.
The European Commission has also approved €350 million German state aid in April to support domestic renewable hydrogen production through the Auction-as-a-Service mechanism from the European Hydrogen Bank. The funding will come in the form of direct grants per kilogram of green hydrogen produced and will be available for up to ten years. The goal is to support the construction of up to 90 megawatts of electrolysis capacity, and to incentivize the production of up to 75,000 metric tons of renewable hydrogen in Germany.
The term ‘energy transition’ is a hot topic at global climate summits, in the news, and during policy discussions. It typically suggests a shift towards renewable energy sources like solar and wind. Yet, this definition often misses broader challenges, particularly in regions outside the developed areas of Europe and the United States, where many still rely on basic energy sources like firewood.
In developed countries, the narrative focuses on adopting clean, renewable energy technologies, with a push for global adoption. This progressive stance can overshadow the unique challenges of countries not as advanced on this path. For example, Mexico still struggles with transitioning away from harmful energy sources like coal and fuel oil. These polluting sources have significant environmental and health impacts. Notably, between 13.5 and 20 million Mexicans use firewood for cooking, making it more prevalent than natural gas. Globally, over 2 billion people use biomass for cooking—double the population of developed countries in Europe and the U.S.
This disparity in energy transition stages highlights that there is no one-size-fits-all solution. Voltaire aptly said, “Perfection is the enemy of good.” In terms of energy transition, this means that while the ultimate goal may be a complete shift to renewable sources, intermediate steps are both inevitable and necessary. Overemphasis on clean fuels alone can reduce investments in more accessible, albeit less clean, fuels. This could lead to setbacks, like an increased reliance on firewood by those unable to afford alternatives like LPG or natural gas.
Transitioning from firewood to LPG, or from coal and fuel oil to natural gas, are not perfect solutions, but they represent significant steps in reducing environmental impact and improving public health. Waiting for a 100% clean and non-hydrocarbon based energy solution shift forces millions, especially the disadvantaged, to continue enduring precarious energy sources. Furthermore, reliance on firewood disproportionately affects women, who often bear the responsibility of cooking and are exposed to harmful smoke. In some countries, collecting firewood also falls to young girls, preventing them from engaging in productive activities like attending school. This exposure can lead to respiratory diseases in vulnerable groups like older adults and children. India’s embrace of LPG has proven successful in addressing these challenges, showcasing the benefits of a flexible approach to energy transition.
The path to a sustainable energy future involves dismantling an established global system, a process that is inherently disruptive and requires both social and infrastructural changes. While renewable technologies hold promise, they still need to prove their reliability, affordability, and scalability to meet global energy demands.
It would be misleading to consider any single technology, such as hydrogen or electrification, as the ultimate solution. Each region has its unique circumstances—geographic, economic, and social—that shape its energy needs and solutions. A diversified, “buckshot” approach, tailoring a variety of technologies and strategies to specific regional needs, is crucial for advancing towards a sustainable future.
The journey towards energy transition is as varied as the landscapes and challenges of the world itself. While the goal of a sustainable and cleaner energy future is universal, the pathways to achieve it are as diverse as the regions they traverse, highlighting the importance of adaptable strategies. For millions around the globe, a transition without LPG is unimaginable.
Navigate NGL & Naphtha Markets with Unmatched Insights