How To Read Your Wholesale Rack Report
Your wholesale rack report is an invaluable tool to help you make sure you are not being overcharged by your supplier. It can help you know where and when to get the best deal for your fuel and save money through writing savvier contracts.
But, if you are new to reading a report like this and don’t understand what it’s telling you, this essential data will do you little good.
Here’s a step-by-step guide on how to read your wholesale rack report so you can buy fuel like a pro.
- Are you getting your racks in real-time, wherever you are? Find out more.
Step 1: Make Sure You Know What Kind of Report You Have
Standard or Terminal?
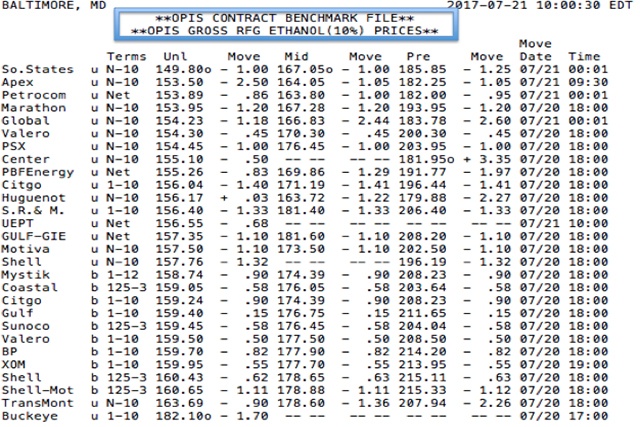
A standard report provides one price per product, per supplier, in a given geographic market. OPIS chooses the most representative price for each supplier based on a variety of factors.
It looks like this. Note, it doesn’t “say” standard in the section header.
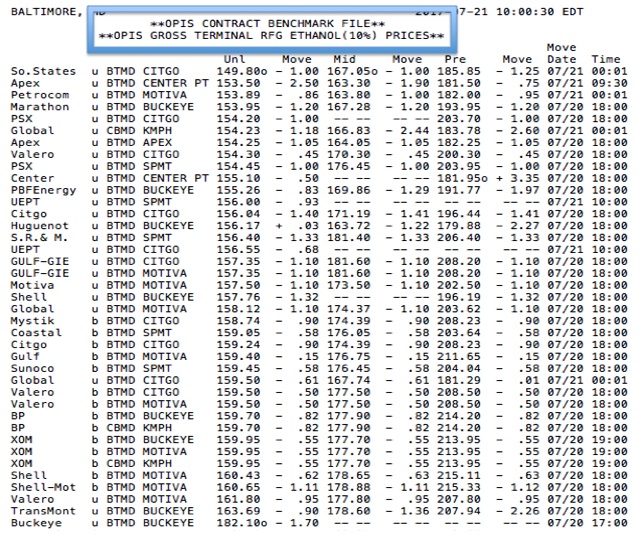
A terminal-specific report provides prices for each supplier and product, broken down by the specific terminal where the price is available. If your report is terminal-specific, the word “terminal” will appear in the heading.
It looks like this.
Gross or Net?
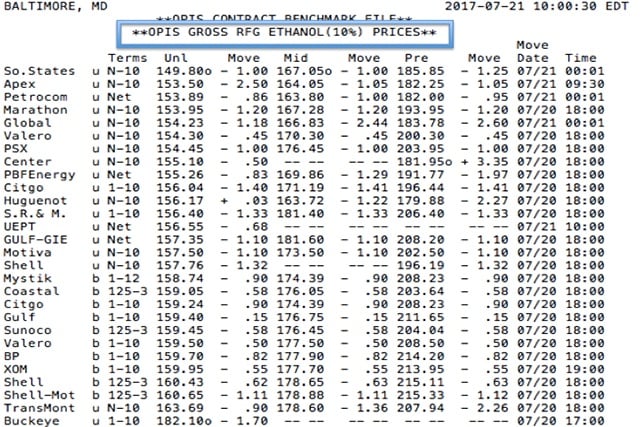
Our standard reports feature a Terms column that tells you if a supplier offers a discount for prompt payment. But, whether the prices you see include those discounts depends on the type of report you receive.
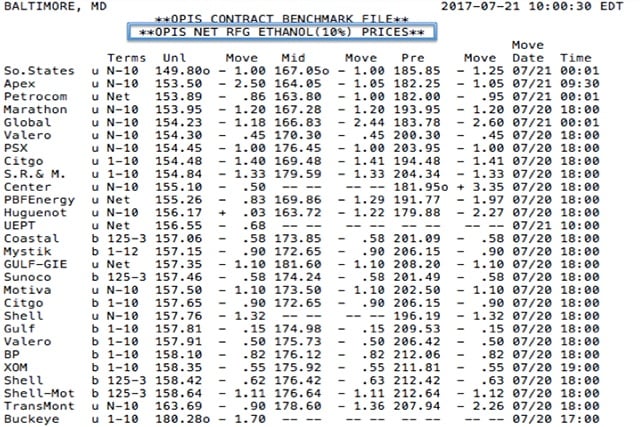
Your report will clearly state whether prices are “gross” or “net” in the top header.
Gross reports do NOT include the discount in the Terms column in the listed price.
Terminal reports do not include a Terms column.
Net reports will have discounts from the Terms column factored into prices.
For more on payment terms, click here.
Step 2: Get Comfortable With The Top of Your Report
From this point on, we’ll use an OPIS gross, standard rack to walk you through your report.
Location
The upper left corner of each section contains the city or metro area covered by the report.

Delivery Times
We freeze prices at key times of day so buyers and sellers can index transactions to our prices at fixed points in time. Most of our customers receive their reports at 10am Eastern Time (Contract), before 6pm ET (Closing) or approximately 11:59pm ET (Calendar Day).
The delivery type (in this case, contract, indicated in blue) is located in the top center of each section with the delivery time in the upper far right corner (indicated in red). 
Step 3: Walking Through Your Specific Products
The top center of each section contains broad product descriptions for the data that follows – ex: gasoline, diesel, ethanol or biodiesel blends.
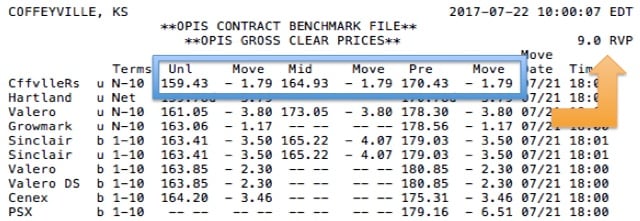
Gasoline: Just below the section headings are column headers containing specific grades or types of gasoline available. These horizontal headers generally reflect prices for regular, mid-grade and premium octanes.
RVP: Just below your report’s date stamp, gasoline reports may indicate the Reid Vapor Pressure of the gasoline products shown. RVP measures gasoline pressure and is mandated to specific levels by state and local governments as an ozone control mechanism.
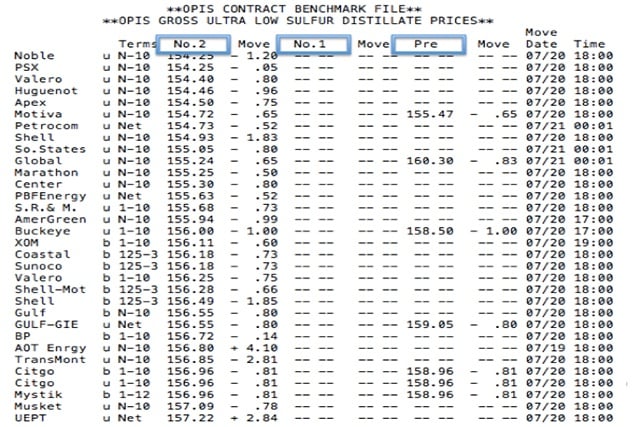
Diesel Reports: For diesel, or distillate as is it is usually labeled, the most common headings are No. 2, No 1, and Premium. You may also sometimes see WNT for winter-spec product or RD for red-dyed diesel, which is for use by tax-exempt entities, like school districts, or for off road use, like farm equipment.
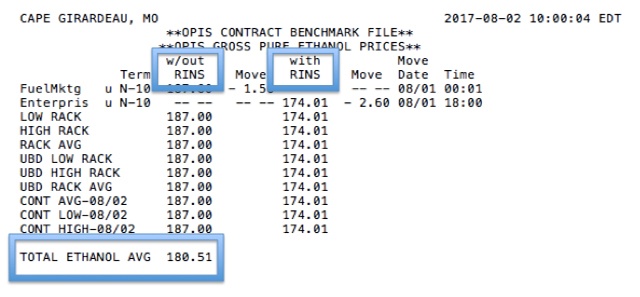
Ethanol Reports: Pure ethanol prices are designated by whether the Renewable Identification Number (RIN) is included in the price. RINs are essentially a serial number assigned to biofuels under the U.S. government’s Renewable Fuels Standard and are required by fuel refiners, importers, or blenders as a representation of the amount of biofuel being used in America.
The total ethanol average is an average of all the ethanol prices in a location, regardless of whether they include the RIN or not.
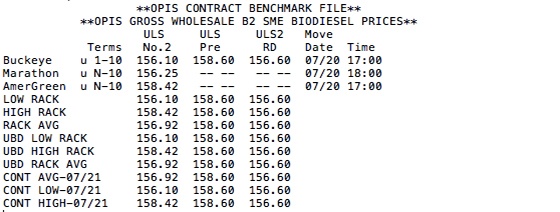
Biodiesel: We report B20 and below prices in our regular rack reports. Higher blends are included in a separate report, OPIS Biodiesel Rack Prices.
Step 4: Now Let’s Go Column by Column
Suppliers Column: The first column in the report lists who is offering a particular price. Some supplier names are abbreviated.
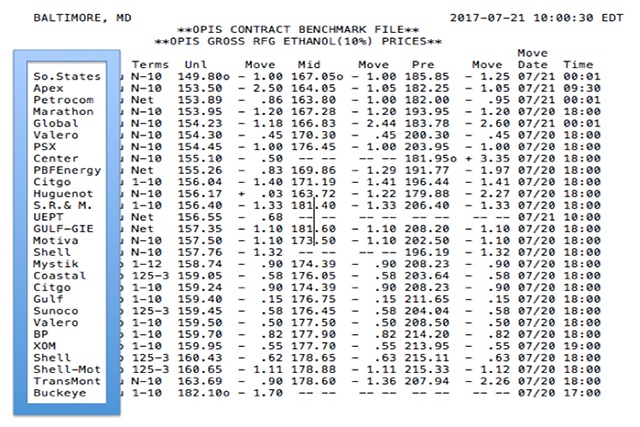
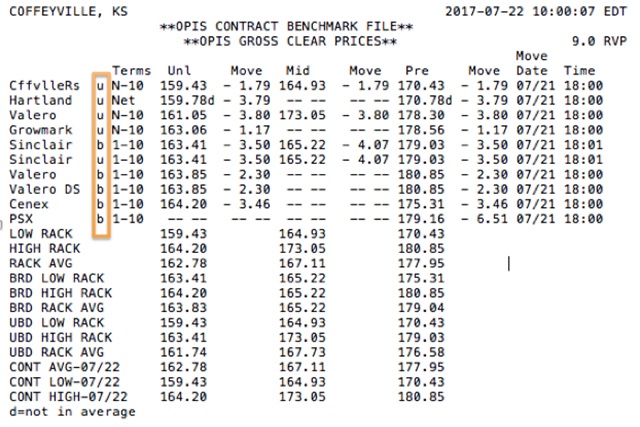
Branded or Unbranded: Gas stations and jobbers associated with a particular gasoline brand MUST buy branded product, which contains the special additives that differentiate the product. Independent retailers and distributors can purchase from whomever they want.
Column two indicates whether the product and price indicated are branded (B) or unbranded (U). A supplier may be listed multiple times if they offer both branded and unbranded product.
Prices: To find a specific price, find where the supplier and the product intersect. Prices are in cents per gallon. You just need to move the decimal point two places to the left to get dollars per gallon.
If a price has the letter D next to it, it means that it will not be included in any OPIS summary data (lows, highs, or averages). This may mean the price has failed one of our quality control mechanisms (learn more about them here) and we don’t want that data to compromise our averages.

If the letter O appears next to a price, it means that supplier is out of the product indicated. These numbers are also excluded from our averages as they do not represent real, saleable gallons.

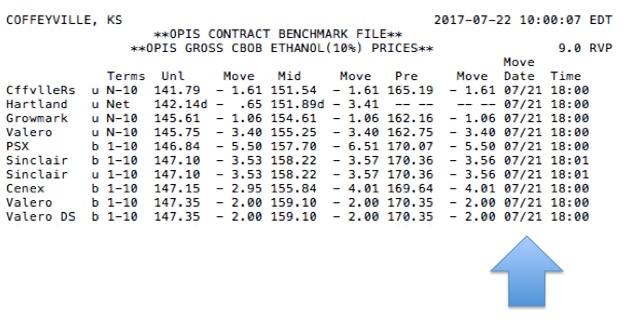
Moves: The amount of the price move will be displayed to the right of the price. The far-right column of the report indicates the effective time of the price and move. All moves are in local time. Moves are based on the amount of change since the supplier’s last price update NOT the last report. If a supplier hasn’t changed their price from the previous report, the most recent price move will still be displayed. OPIS reports prices immediately, as they become effective, which often reflects an intraday move during the current day.
Step 5: Special Sections
In addition to providing supplier pricing, OPIS also calculates the low, high, and average of all suppliers in a market.
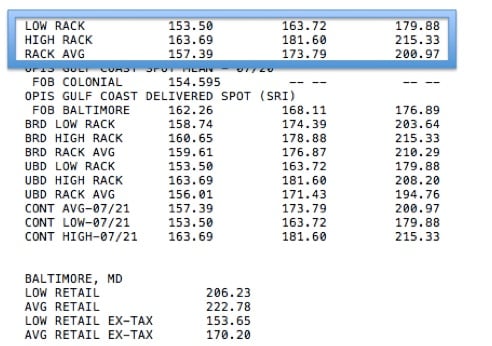
Your report may also include summary data for all branded or unbranded suppliers.
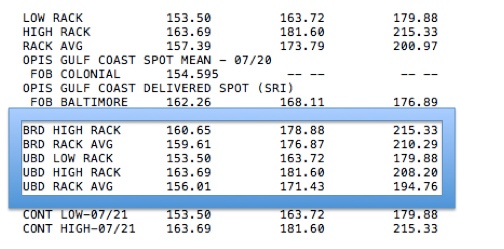
Some reports also have the OPIS average for one of our benchmark delivery times.
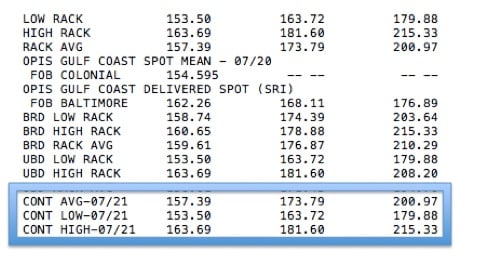
The OPIS Spot Mean shows the previous day’s average price for products we track in the spot market associated with the rack location.Learn more about spot markets here.

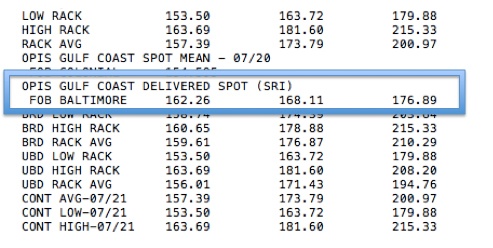
The Delivered Spot or Spot Replacement Index estimates the cost of product delivered from the bulk market listed to the rack, including tariffs, fees, product shrinkage and other transportation costs. This is essentially the suppliers’ cost to get the product to the terminal. Learn more about how this influences your rack prices here.
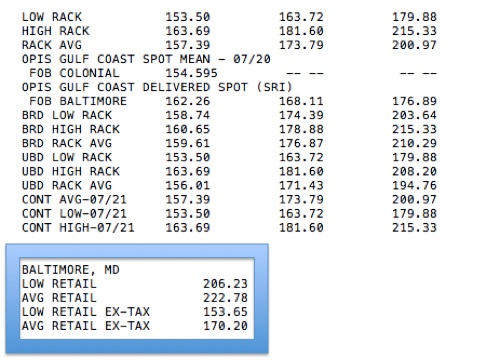
The OPIS Smart Rack data at the bottom of some reports provides a 3- to 4-day average retail price for regular unleaded gasoline in the metro statistical area. This data can you calculate margins and get an overview of the local retail market.
Interested in retail markets? Click here.
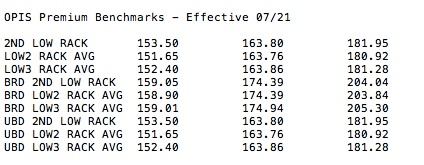
In addition, some reports include premium benchmarks, which calculate some of the most commonly referenced averages used in contracts. They include:
- Low 2 and Low 3 Price for all suppliers
- Branded Low 2 and Low 3 Price
- Unbranded Low 2 and Low 3 Price
- A listing of the 2nd lowest price, the 2nd lowest branded price and the 2nd lowest unbranded price
Step 6: California Dreamin’
In the fall of 2014, OPIS began including a daily California Cap-at-the-Rack (CAR) Assessment stemming from cap-and-trade regulations on gasoline and diesel fuel.
Suppliers did not come to a single standard on how they would handle CAR costs. Some suppliers include it as a line item on invoices while others wrap the fee into the posted rack price. Because of the lack of standardization, OPIS “normalizes,” prices so our rack data compares “apples to apples.”
This normalization has resulted in three report options. Here are explanations and examples of each report type:
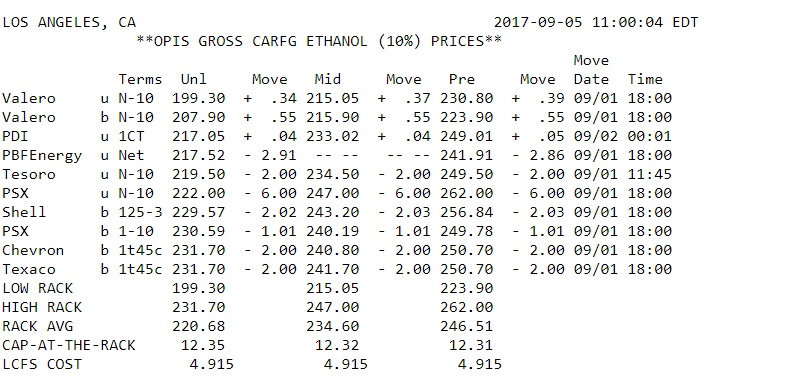
- Non-Adjusted – OPIS reports reflect the prices posted by suppliers even when some suppliers include the CAR value in the posted price, while others pass the CAR on as a line item on invoices.
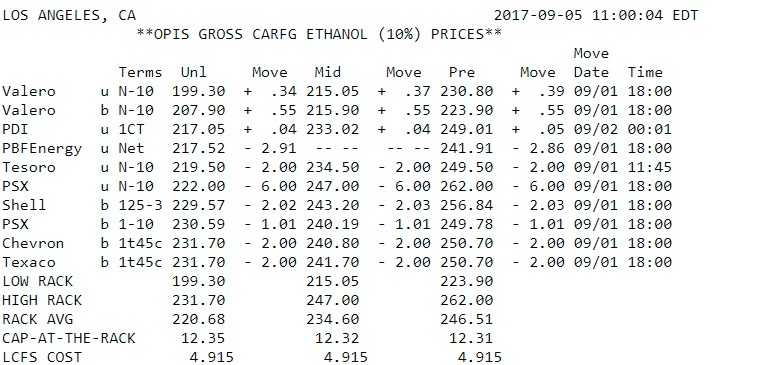
- Normalized, With CAR Cost – Reports will adjust the prices of suppliers who do not pass the value of the CAR posting along in their posted price by adding the OPIS CAR Value or the suppliers’ own CAR value. Benchmark Averages will reflect the OPIS normalization and supply contracts may need to be adjusted to index this method. Note: The OPIS CAR Value is updated after the West Coast spot market report is published. That number gets carried through until the next spot publish.
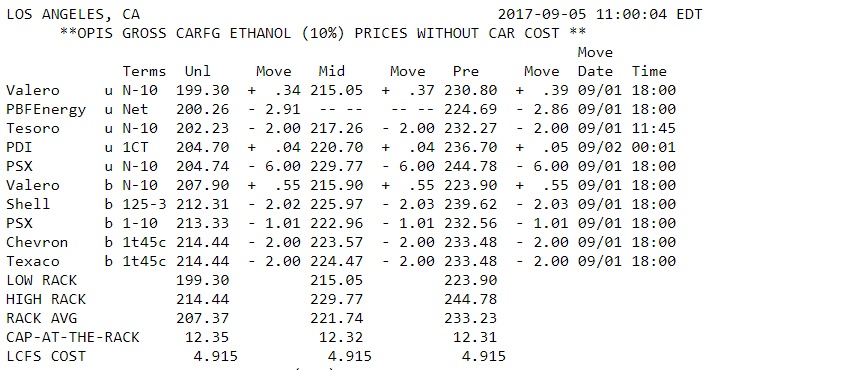
- Normalized, Without CAR Cost – Here, OPIS will adjust the prices for suppliers who pass along the value of the OPIS CAR in their price, by REMOVING the OPIS CAR Value from the suppliers’ posted price. Again, Benchmark Averages will reflect the OPIS normalization and supply contracts may need to be adjusted.
So, there you have it! This roadmap of your wholesale rack data will help get you on your way to buying fuel with greater confidence, armed with price transparency. As always, if you have any questions, our customer service team is just a click or a call away, ready to solve any problems that arise.
Now that you have a better understanding of your report, can you think of any data you need to revisit for price verification? OPIS has the historical prices you need.
