A Tale of 2 Seasons: Factors That Shape Fuel Prices During Hurricanes
No two storms are created equal. The unique landfall of every storm is one of the most important factors and critical to the amount of time fuel values may stay elevated.
Before this past hurricane season, a major hurricane (Category 3 or higher) had not hit the United States since 2005, when Hurricanes Katrina and Rita ravaged the Gulf Coast. This year saw Hurricanes Harvey and Irma have a huge impact on Gulf Coast refinery operations, supply and demand in a fairly large swath of the country.
While the 2017 hurricanes had similarities to Katrina and Rita from 2005, there were mostly differences.
One of the major variables between the 2005 and 2017 clusters was where the storms hit. Katrina and Rita struck the heart of the Gulf Coast refining center. Only Hurricane Harvey had an impact in that region 2017 – though it was certainly a big one.
Refinery Runs Tell the Story
A quick look at historical EIA data shows that just before Hurricane Katrina, Gulf Coast refineries had been processing 7.979 million b/d of crude oil and other feedstocks. Refinery runs dropped immediately on flooding and wind causing damage shutdowns. A few weeks later, Gulf Coast runs were once again approaching 7 million b/d. But, then, Hurricane Rita took a more westward path toward Houston, providing the double whammy that took crude and feedstock processing to just 3.554 million b/d. From pre-hurricane runs, to when they bottomed, Hurricanes Katrina and Rita caused a roughly 55% drop.
Since 2005, Gulf Coast refiners have added a significant amount of refining capacity. Just before Hurricane Harvey, Gulf Coast refinery runs were at 9.358 million b/d, according to EIA, and dropped to as low as 5.915 million b/d. The pre-storm run level to the processing trough was just shy of 37%, well below the run slump created by Katrina and Rita.
Some meteorological differences may have limited the percentage declines from Harvey, when mostly heavy rain and flooding were key elements. Hurricane Katrina not only had floods from rain, but also significant storm surge and wind damage.
Retail Gasoline Prices During The Storms Add Details

- Track real-time prices from 140,000 retail fuel stations with OPIS PricePro.
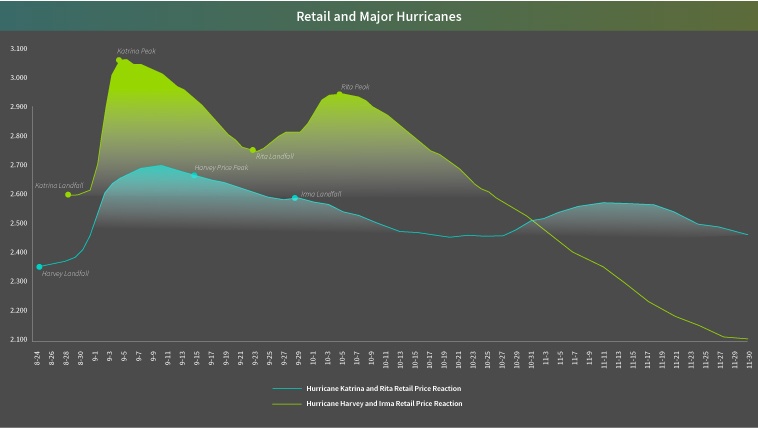
Retail gasoline prices in 2005 and 2017 reacted similarly as the storms and damage to refineries caused huge spikes in prices. The degree to which prices jumped was the differentiator.
Circumstances at the time should be considered. In 2005, the “peak oil” theory was gaining momentum and prices were on an ascent to all-time highs achieved in 2008. Rising prices were being blamed on the U.S. not having built a refinery from the ground up since the mid 1970s and demand was only forecast to go higher.
Fast forward to 2017 and you saw global oil markets working off an epic glut. While 2016 represented an all-time high for gasoline demand, most analysts believe that gasoline demand is going to decline or at-best plateau.
With the above circumstances considered, it should not come as a surprise that gasoline prices spiked from $2.601/gal on August 28, 2005, the day before Hurricane Katrina made landfall in Louisiana (incidentally its 3rd landfall after briefly hitting Florida and Mississippi). The panic in the market pushed prices quickly; just six days later U.S. retail gasoline skyrocketed by 40cts to $3.00/gal, according historical AAA data. Ultimately, Katrina’s influence peaked prices at $3.057/gal on September 4-5.
Though refinery operations still took a hit and were still well below pre-Katrina levels, markets cooled off and so too did retail prices. Less than three weeks later, prices were down 30cts at $2.755/gal.
Hurricane Rita’s landfall on September 23 began the panic again, but this time in muted tones, as prices peaked at $2.941/gal 11 days later. Although the price spike was more subdued, it did take refinery operations to one of the lowest levels on record on the Gulf Coast.
Whether it was storm fatigue in the markets or typical seasonal patterns, prices dropped quickly. Changes to demand in the fall and seasonal gasoline RVP requirement shifts were probably the most likely catalysts that accelerated the decline for prices in the 4th quarter of 2005. By October 26, the average retail price for gasoline stood at $2.593/gal, back to pre-Katrina levels. All told, it took about two months for prices to return to “normal” and despite refinery runs not coming close to the late-August levels for some time, prices at the end of hurricane season stood at $2.14/gal.
This Year’s Tale of Woe for Fuel Prices
Once again, circumstances were much different in 2017 than they were in 2005, as global inventories were considered bloated, But Hurricane Harvey caused a similar, albeit quieter, spike in prices.
Hurricane Harvey hit the Texas coast just before Labor Day and on August 24,, 2017 retail gasoline prices were at $2.348/gal. However, with Hurricane Harvey expected to have more of an impact on the Corpus Christi area, prices did not move with any sort of fervor for several days.
While Hurricane Katrina produced a 40cts spike in U.S. retail averages, Hurricane Harvey produced a spike of just over 30cts, as prices peaked at $2.6737/gal on September 7, almost two weeks after Harvey made landfall.
Location, Location, Location
Just a few days after prices peaked, Hurricane Irma hit Florida. That landfall presents the key difference in price-spike comparisons.
Hurricane Irma had no impact on Gulf Coast production. However, still-present supply concerns from Harvey and Gulf Coast refineries limping back to health slowed the overall U.S. price decline.
Retail gasoline prices have been on a downward path since topping $2.67/gal on September 7. But at the end of hurricane season, prices are still around 15cts higher than where they were before Hurricane Harvey hit Texas. Refinery runs on the Gulf Coast have improved, but they are also not quite back to pre-Harvey levels either.
Crude Offers Clues
Crude oil prices and their direction may shed more light how prices reacted after Hurricanes Katrina and Rita versus Hurricanes Harvey and Irma.
Just before Hurricane Katrina, WTI futures were trading in the $67.50/bbl area. By the end of the 2005 hurricane season, prices were a little over $10/bbl cheaper at $57.32/bbl. Prompt-month WTI futures were just shy of $48/bbl when Hurricane Harvey made landfall. Prices then increased by nearly $10/bbl by the time hurricane season came to a close.
Finally, Demand Destruction is a Constant Antagonist When It Comes to Fuel Values
Though prices can behave erratically, the one constant, regardless of where a hurricane makes landfall, is demand destruction.
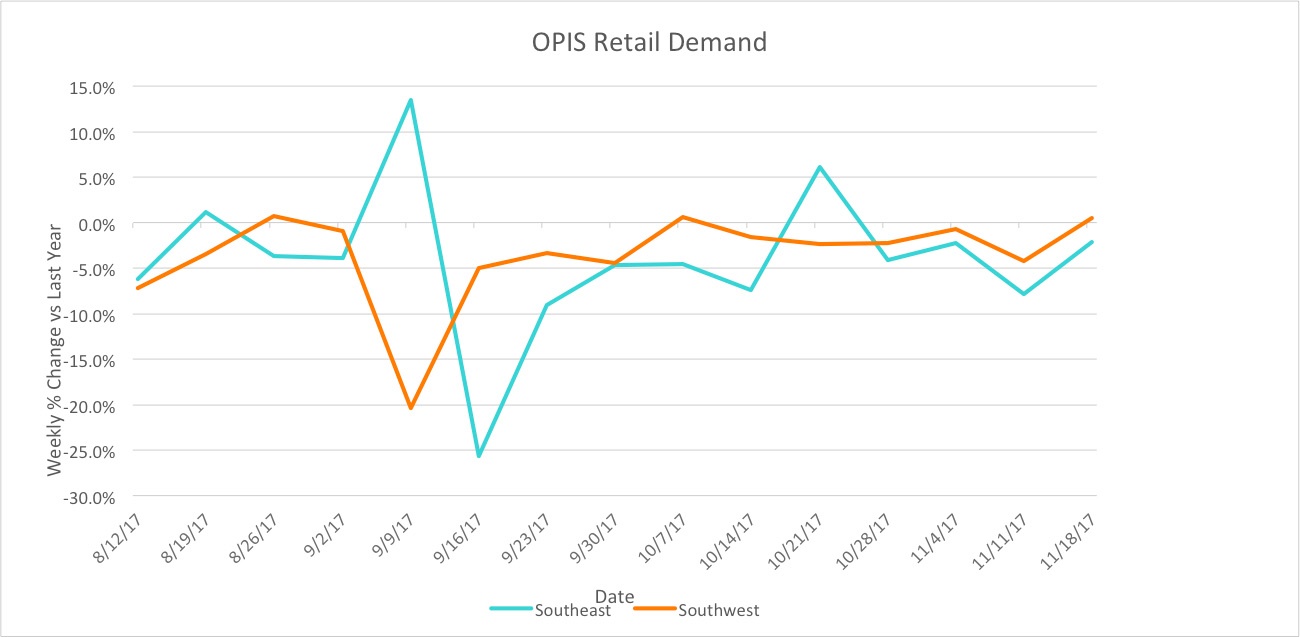
OPIS, for the past couple of years, has tracked retail gasoline sales volumes at more than 10,000 stations around the country and the evidence of demand destruction becomes quite clear when these numbers are analyzed.
Just ahead of a hurricane, retailers usually see a spike in demand as motorists fill up ahead of a storm making landfall or for evacuations. First responders also have to prepare vehicles for emergency services. Once a storm hits and power is lost or roads become flooded, vehicles do not have the ability to move, leaving a void in demand. Typically, the demand recovery can take several weeks to return to pre-hurricane levels.
The chart below illustrates gasoline demand in the Southeast and Southwest before, during and after Hurricanes Harvey and Irma, comparing percentage changes year-on-year.

Hurricanes will always have some sort of impact on prices, but the amount and length of time that prices are impacted can vary greatly by where the hurricane makes landfall.
And as data shows us, it is also easy to conclude that regional demand destruction is not a myth.
Act on operational events that affect the production of fuel with OPIS’ current and complete list of planned and unplanned U.S. refinery work, the OPIS Refinery Maintenance Report.
