OPIS Market News

The Gulf Coast spot gasoline market will face several developments that could affect prices in 2025, including the first-quarter closing of LyondellBasell’s 268,000 b/d Houston refinery, export demand, and a planned RVP change in eight Midwest states this summer.

LyondellBasell, which in 2022 announced plans to close its sole refinery by the end of Q1 2025, announced in October it planned to begin closing some units at the facility as early as January. The company said in a Securities and Exchange Commission filing that current economics don’t justify waiting until the end of the quarter to close the plant, adding that it suspects that year-end “seasonality” will result in softer demand across multiple businesses.

Lyondell said it plans to begin shutting its crude distillation unit and a coker in January and plans to take the fluid catalytic cracker out of service in February. Without that equipment, the company will not be able to process heavy sour crude. That updated timetable makes it likely the plant will not be able to produce gasoline in the second half of the first quarter.

“You are minus that for starters for the region, and you will either have a redistribution of product flows from other regions of the country,” a market source said. “I’m guessing [the Midwest] PADD 2 might be a source of redistribution of products for Wood River or Whiting, or maybe even Irving on the East Coast. Other refiners in the Gulf Coast [PADD 3] could increase production. The Explorer Pipeline can pipe product to the Gulf Coast and Capline has been reversed and can help with this.” Irving Oil’s 320,000 b/d refinery is in New Brunswick, Canada, and the Explorer Pipeline conveys refined products from Texas to points in the Midwest. The Capline Pipeline runs from Illinois to Louisiana. Work was completed in 2021 to allow the line to transport crude oil from the Midwest to Louisiana.

Some market sources expect the refinery’s closure will likely have little impact on Gulf Coast spot gasoline trading, given recent capacity additions in the region. They include a 250,000 b/d expansion of ExxonMobil’s Beaumont, Texas, refinery, a new coker at Valero Energy’s Port Arthur, Texas, plant, a 40,000 b/d addition at Marathon Petroleum’s Galveston Bay, Texas, facility and a 38,000 b/d capacity addition at Citgo’s Lake Charles, La., refinery.

In addition, Chevron said recently it completed a project at its Pasadena, Texas, refinery that is expected to increase the facility’s ability to process lighter crude oil grades by 15% to 125,000 b/d.

The Gulf Coast gasoline market could also benefit from new supply from the 650,000 b/d Dangote refinery in Nigeria. The closure of the Lyondell plant could come as Dangote ramps up gasoline and distillate production. The company recently sent its first cargo of jet fuel to the U.S. and has been working to reduce sulfur in its gasoline and diesel output to meet U.S. and European gasoline and diesel specifications. If and when that could happen is unclear.

Once market source said production of on-spec fuel from Dangote could help to keep cracks depressed in the new year.

“I don’t think Gulf Coast differentials will be too impacted, but the Dangote refinery is going to keep the Atlantic basin flush with supply, so cash refining cracks should be pretty depressed for a while,” the source said.

In addition, exports, which in recent months have affected Gulf Coast gasoline differentials, will remain an issue in 2025, sources said.

“A key will be exports, this will track close to Asian demand and the Chinese economy, as well as their fuel substitution,” another source said.

The Energy Information Administration recently said PADD 3 gasoline exports in September fell to an average of 660,000 b/d from 745,000 b/d in August. Although total exports from the region have been below where they were at times in 2023, they will remain a critical part of the gasoline market in 2025.

Gulf Coast refiners have reported strong demand from Brazil and Mexico in recent months and refinery runs in the region remain high.

Refinery rates for much of November have been in the mid-90% range and utilization is closing out the year at one of its highest levels since summer.

“Export demand has been driving [differentials] in a big way to end the year,” a source said.

Gulf Coast gasoline discounts to the NYMEX, particularly for CBOB, have been narrowing in recent weeks, something another source attributed to strong export demand. But any slowing in exports could cause differentials to weaken sharply.

“Exports are on [the] move up,” a source said about the recent strength in gasoline differentials. “When that slows, we’re going to come screaming off.”

Sources are also keeping a close eye on the potential 1-lb psi RVP waiver in the Midwest, which could have a ripple effect on Gulf Coast refiners.

The governors of eight Midwest states in 2022 petitioned EPA to eliminate the 1-lb waiver that has prevented the sale of E15 in those states during the high-demand summer driving season. While the EPA approved the request, it delayed implementation until spring 2025.

But a number of sources told OPIS they believe it is likely the waiver will be delayed by another year. But if not, then refiners will have to make a lower RVP blendstock for those states.

A study conducted by consultants Baker & O’Brien said that removing the waiver could lead to short gasoline supplies in the affected states which could lead to the Midwest taking more fuel from the Gulf Coast.

Potential U.S. tariffs from the incoming Trump administration in the new year could emerge as a wild card for the market.

“The RVP waiver … and a potential tariff on Canadian oil could definitely have a ripple effect on Gulf gasoline,” a source said. “It definitely feels like the market thinks oil will be excluded, but if it’s not, watch out. The RVP waiver just adds more uncertainty on how it will work, will we see demand shifts, etc.”

President-elect Trump’s pledge to impose tariffs of 25% on imports of all goods from Mexico and Canada could affect nearly 25% of U.S. refinery crude throughput and raise the cost of crude oil, according to a recent analysis by Tudor, Pickering, Holt & Co.

According to the investment bank, U.S. refiners processed about 4.03 million b/d of crude oil from Canada over the last 12 months, accounting for nearly 22% of all U.S. throughput. The bank added that 71% of those barrels landed in the Gulf Coast, with 11% sent to the Midwest.

In addition, TPH said U.S. refiners ran 587,000 b/d of crude oil from Mexico over the last 12 months, a volume equal to more than 3% of total U.S. output. Some 87% of Mexican barrels landed on the Gulf Coast.

One industry source said that if Trump makes good on his tariff promises, some of those costs would be passed through to buyers, raising the price of Canadian crude and leading to higher retail gasoline prices in the Midwest.

Should that happen, the source said it is likely that Gulf Coast barrels will be moved to the Midwest if the arbitrage opens.

Market participants are also keeping an eye on small refinery exemptions from compliance with the Renewable Fuel Standard program.

The Supreme Court in October said it would hear a refining industry petition to hear a case that could decide which federal court should hear SRE-related litigation after the 5th U.S. Circuit Court of Appeals in November 2023 overturned an EPA decision to deny SRE petitions from refiners.

“The Supreme Court ruling on waivers is the biggest wildcard,” a source said. “[It] could be a tailwind to refiners and help profit margins and add viability to projects. Definitely more of a diesel market impact, though. If the court rules in favor of SREs, then I would say refiners could shift toward diesel instead of gasoline.”

The U.S. Midwest spot refined product market began 2025 with questions over whether the Trump administration will impose tariffs on Canadian oil imports and uncertainties over how summertime sales of E15 in the region will affect gasoline supply.

Roughly 60% of U.S. oil imports in 2023 originated in Canada and accounted for 24% of U.S. refinery output, according to Energy Information Administration data. And Midwest (PADD 2) refineries, many of which are designed to handle heavy oil like those produced in Canada, are by far the largest consumers of Canadian crude, importing more than 2.6 million b/d in 2023, EIA said. The region accounted for nearly 62% of all Canadian crude imports in 2023. While Western Canadian Select crude has typically been priced at a discount to West Texas Intermediate, PADD 2 refiners could see that pricing dynamic upset by Trump’s proposed 25% tariff on Canadian oil.

Petroleum analyst Philip Verleger said potential Trump tariffs would put Midwest refiners at a significant disadvantage to Gulf Coast refiners and could force two to four refiners in the region to close their doors.

U.S. imports of Canadian crude oil in the fourth quarter of 2024 rose to record highs following the completion of the Trans Mountain Pipeline expansion project, which provided increased maritime access for oil exports from western Canada. The U.S. imported 4.3 million b/d of Canadian oil in July 2024, almost 33% more than the 3.245 million b/d imported in July 2023, according to EIA’s analysis of Canadian imports. Proponents of the expansion project had hoped that increased takeaway capacity and access to additional markets would boost the price of Canadian crude. But EIA said the results have been mixed.

Western Canadian Select crude discounts in previous years often increased in the fall, as refiners in the U.S. Midwest cut back on imports due to seasonal maintenance work. With increased export opportunities due to the expansion project “if the price differentials remain near current levels through the end of the year, it may suggest that the added TMX capacity has helped to insulate Canada’s crude oil producers from the operational decisions of refiners in the U.S. Midwest,” EIA said.

Midwest market participants will also have to deal with 2025 year-round sales of E15 in most states in the region. EPA, responding to requests by the governors of Illinois, Iowa, Minnesota, Missouri, Nebraska, Ohio, South Dakota and Wisconsin, in early 2024 agreed to waive Clean Air Act fuel volatility limits that had prevented the sale of the higher-ethanol gasoline blend from June 1 through Sept. 15. The agency’s order, which goes into effect in late April 2025, essentially puts E10 and E15 on equal footing.

Refiners, however, opposed the decision, arguing that it would require them to produce a low-RVP blendstock for just a small part of the U.S. market. In addition, the decision has prompted logistical concerns given that pipelines could be forced to move two different CBOB RVP specifications over the summer.

The American Fuel & Petrochemical Manufacturers in November 2024 asked EPA to delay the decision for a year, citing possible supply disruptions, higher fuel prices over the 2025 summer driving season.

In addition refinery consultant Baker & O’Brien warned in a study that the move would lead to supply disruption given low gasoline stocks in the Midwest. The company estimated the change could reduce PADD 2 gasoline output by 131,000 b/d and raise the region’s imports of motor fuel by 39,000 b/d.

The tariff and E15 worries come after the Midwest gasoline and distillate spot market experienced significant price volatility in 2024. Group 3 sub-octane gasoline hit a 2024 high of $2.5072/gal on March 19 and year-to-day low of $1.7187/gal on Dec. 6. Spot gasoline prices in Chicago reached a 2024 of $2.64/gal high on July 31 and a low of $1.5903/gal on Jan. 8. Gasoline stocks in the region were also volatile, peaking in February 2024 at 61.697 million bbl and falling to 44.299 million bbl in November. In the spot distillate market, Group 3 ULSD peaked at $2.7257/gal on March 18, 2024, ahead of the spring planting season, and fell to a year-to-date low of $1.9426/gal on Dec. 6. The spot price for Chicago ULSD reached a 2024 high of $2.8332/gal on March 18 and set a year-to-date low of $1.93175/gal on Sept. 10. Midwest ULSD Inventories rose to a 2024 peak of 34.401 million bbl in February and a year-to-date low of 26.301 million bbl in November.

The New York Harbor spot refined products market, which has long depended on imports, has started off 2025 with uncertainty over whether the U.S. will impose tariffs that could force the region to look for alternative sources of supply.

President-elect Trump has promised to impose tariffs on Canada and Mexico and many market participants in the Northeast will be watching to see whether he makes good on the proposal and what effect that will have on market dynamics.

The East Coast (PADD 1) relies heavily on product imports from Canada, which over the first nine months of 2024, supplied the region with 29.508 million bbl, according to Energy Information Administration data.

Over that period, Canada was the third-largest exporter of finished gasoline to PADD 1, trailing only the Netherlands and Norway, EIA numbers showed.

EIA said Canada’s imports of finished motor gasoline into PADD 1 through September totaled 3.154 million bbl, or more than 14.5% of the total.

Canada led all exporters in sending jet fuel to PADD 1, accounting for 2.553 million bbl, or 43.4% of the region’s total imports in the first nine months of 2024.

Petroleum analyst Philip Verleger in early December said potential tariffs on Canadian and Mexican imports could increase the cost of crude oil from both countries by $16/bbl.

Irving Oil’s refinery in New Brunswick, Canada, and Valero Energy’s refinery in Quebec, which EIA said account for bulk of distillate and gasoline exports to PADD 1, would also be impacted by tariffs.

In addition, any tariff-related decline in Canadian gasoline exports to the U.S. could lead to higher shipments of Gulf Coast Products to the East Coast via Colonial Pipeline’s Line 1, a development that would likely increase the cost of moving fuel to the region.

Line space costs on Line 1 in 2024 peaked in mid-April at 12cts over tariffs and remained at a 10ct or more premium to tariffs for five straight days. For much of the fourth quarter, space on Line 1 was at a premium to pipeline tariffs.

East Coast market participants will also be watching to see whether the price of jet fuel in the Northeast will remain under pressure. Barge, Buckeye and offline Colonial spot jet fuel prices in late November fell to $2.1493/gal, down more than 90cts from where they were trading at the same time in 2023.

New York Harbor jet fuel in 2024 hit a peak of $2.92/gal on Feb. 9 at $2.92/gal, when it traded at a 3.5ct discount to the NYMEX. That was well below the 2023 peak of $5.64/gal reached on Jan. 26.

Spot jet fuel values in the Northeast did not fall below $2.10/gal in 2023, with the year’s low coming on May 4 at $2.13/gal. In 2024, prices slipped below $2/gal on three days, with a low of $1.98/gal coming on Sept. 10.

Market participants in the new year also will be keeping track of developments at the 650,000 b/d Dangote refinery in Nigeria. The new facility is working to produce gasoline and diesel that meets U.S. and EU specifications, but when that will happen is unclear.

One market participant said refining margins on gasoline could suffer if and when products from Dangote arrive. “That is what happens when complex refining grows at the rate that it has … with Dangote. The weak basic refiner gets squeezed,” he said.

The major refiners will release earnings by mid-November, and the refining margin results will likely disappoint Wall Street.

Most analysts anticipate weak 2024 third-quarter refining margins, and earlier in October, ExxonMobil, BP and Shell warned of lackluster earnings potential.

ExxonMobil said lower oil prices during the third quarter would reduce its earnings by anywhere from $600 million to $1 billion. Lower refining margins were expected to have a similar impact. BP said it expects a $400-600 million hit from soft refining margins.

Shell said that it expected its refinery utilization rates in the third quarter to come in somewhere between 79-83% after forecasting 83-91% in early August. The lower utilization was due to turnarounds in the Netherlands, Germany and U.S. Shell moved up maintenance at its 250,000 b/d Norco refinery in Louisiana after a power outage stemming from Hurricane Francine shutdown a hydrocracker there.

After the outsized refining margins of 2022 and 2023, the search for what a mid-cycle margin might look like may have been found.

OPIS chart: Quarterly Average Refined Product Crack Spread Vs. WTIBased on NYMEX WTI, RBOB and ULSD futures, the average RBOB crack spread in the third quarter was $19.94/bbl, which is down roughly 38% or $12.35/bbl from the 2023 RBOB crack spread of $32.29/bbl.

The recently completed quarter’s RBOB crack is also less than 2021 and 2022, but it compares quite favorably with the crack spreads in a five-year span from 2015 to 2019 when the average NYMEX RBOB third quarter crack spread was $17.96/bbl.

It would be nearly impossible for diesel to have the same third-quarter performance as it did in the third quarters of 2022 and 2023, when the ULSD-WTI NYMEX crack spread averaged $57.64/bbl and $44.97/bbl, respectively. The most recent third quarter came in at $22.26/bbl, a roughly 50% haircut from a year ago.

Like gasoline, the third-quarter NYMEX diesel crack spread compares more closely with the 2015-2019 period. The average crack spread during that five-year stretch was $20.11/bbl, which sees the 2024 third quarter roughly $2/bbl better than that five-year average.

One certainty, though, is that the third quarter was uneven. The quarter started rather strong in July, but the paper crack spreads decreased in value in the following two months.

While the NYMEX crack spreads are typically a good guide for refinery profitability, looking at the seven U.S. spot markets reveals that very few markets achieved what the paper markets had indicated. Throw in the Renewable Volume Obligation costs and some spot markets significantly underperformed versus the paper market.

Like the paper cracks, some markets turned in the same uneven performance with stronger margins at the front end only to see the crack spread fade into the end of the quarter.

OPIS chart: Gulf Coast Spot Crack Spread Monthly AverageOn the Gulf Coast, the conventional blendstock gasoline market went from a July average versus light sweet crude oil delivered to Houston of $16.95/bbl to just $1.92/bbl in September. When considering processing costs and the renewable volume obligation costs, it’s not a stretch to say that there were multiple days when Gulf Coast refiners were making gasoline at a loss.

Overall, the gasoline crack spread on the Gulf Coast averaged $8.77/gal. Gulf Coast diesel also saw a similar pattern with a $22.70/bbl July average eroding to $9.33/bbl and a quarterly average of $14.38/bbl.

The Gulf Coast gasoline and diesel crack spread was down in the neighborhood of 30% from the second quarter.

The West Coast went against the trend seen in the paper markets and on the Gulf Coast, as the average CARBOB margin rose through the third quarter. The gasoline crack, against Alaska North Slope crude oil, certainly appeared to be more pedestrian, especially compared to the first and second quarters of 2024.

Los Angeles saw an average third-quarter CARBOB margin of $18.40/bbl, according to OPIS spot market data. The July average was inside of $12/bbl, which was the lowest month of 2024 so far. By September, the average margin bumped up to $23.72/bbl. The stronger September was thanks largely to softer crude oil prices, as ANS in September averaged $74.44/bbl. At the same time, the average spot price, according to OPIS data in L.A., was $2.3373/gal.

CARBOB refining margins in San Francisco were about 37% better than Los Angeles’s in the third quarter, averaging $25.21/bbl. Like the L.A. market, the San Francisco CARBOB margin was also aided by the falling price of ANS.

While gasoline crack spreads took a step back, those able to process heavy sour crude were faring much better.

Chicago area refiners that process the heavy Western Canadian Select saw CBOB cracks consistently above $20/bbl, with a third quarter average of $22.31/bbl. ULSD versus WCS averaged $26.63/bbl in the third quarter.

Overall, the Chicago 3:2:1 crack spread against WCS, according to OPIS data, averaged $23.75/bbl, which was largely in line with the second quarter. Compared to WTI futures, the 3:2:1 crack spread in Chicago generally trailed heavy sour crude by about $5/bbl.

Of course, gasoline is always cyclical, and in the past two years, refiners have been able to lean on diesel and jet fuel production, which was not the case during the third quarter.

Diesel was a bit more mixed. Some markets, like Chicago, saw the diesel crack improve by a few dollars per barrel from the second quarter to the third quarter. Gulf Coast saw the diesel crack drop by more than $5/bbl from quarter to quarter.

The San Francisco market saw the largest pullback in the third quarter, dropping $9/bbl. California markets have seen legacy hydrocarbon-based diesel being replaced at a significant clip by renewable diesel. However, even with the incentives, renewable diesel also saw some of its margins clipped in the third quarter.

It should also be noted that the third quarter is among some of the softest periods for diesel demand.

While there was plenty of discussion of strong air travel during the 2024 summer, refiners did not reap the benefits of the stronger demand in the form of strong pricing for jet fuel.

Every spot market saw jet fuel prices drop from the second quarter to the third with the crack spread falling anywhere from about $3/bbl to as much as $8.40/bbl. As a result, a 6:3:2:1 (six barrels of crude oil yields, 3 barrels of gasoline, 2 barrels of diesel and 1 barrel of jet fuel) in several markets were down $3 to $6/bbl in multiple markets.

Besides product weakness to close out the third quarter, the renewable volume obligation cost was seen going up throughout the quarter.

During the third quarter, the RVO averaged 9.27cts/gal or $3.89/bbl, which is the highest quarterly average of 2024. While the third quarter for refining margins are off to a good start, picking up from where September averaged, the RVO is also moving higher as the month to date average for October stands at 10.36cts/gal or $4.35/bbl.

Fun fact of the day: refiners, generally speaking, don’t make gasoline.

Drivers may think that crude oil goes into a refinery and gasoline comes out.

That’s only partially correct. Think of making gasoline as making a cake. There’s flour, eggs, milk, and oil in a cake recipe. Gasoline is similar in that it has multiple components that make up the gasoline recipe. At the end of that recipe you have two types of almost finished gasoline called Conventional Blendstock for Oxygenate Blending and Reformulated Blendstock for Oxygenate Blending.

To these blendstocks other liquids are added to make the substances that fuel our carpools, take us to grocery stores and get our families to their summer vacations. And, mostly, that final mixology does not happen at the refinery level.

The Mixers: CBOB and RBOB

To reiterate, most of the gasoline produced by refineries is actually unfinished gasoline or gasoline blendstock.

Blendstocks are blended with other liquids, such as ethanol, to make finished gasoline.

Most of the finished gasoline in the US contains 10% ethanol.

The blendstocks are a mix of components such as butane, reformate and FCC gasoline, which can be combined in different ways to reach needed specifications.

Conventional Blendstock for Oxygenate Blending (CBOB) is a blendstock that’s combined with ethanol to get E10 gasoline.

Reformulated Blendstock for Oxygenate Blending (RBOB) becomes reformulated gasoline (or RFG) after blending with ethanol.

What’s the Difference Between RBOB and CBOB?

Reformulated gasoline is required in certain areas to reduce smog per Clean Air Act amendments. RFG is required in cities with high smog levels and is optional elsewhere. RFG is currently used in 17 states and the District of Columbia. About 25 percent of gasoline sold in the US is reformulated.

Many of the RFG areas are in the mid-Atlantic and Northeast. So, OPIS spot market editors see a lot more Reformulated Blendstock for Oxygenate Blending (RBOB) trading in the New York Harbor region.

In the Gulf Coast spot market, Conventional Blendstock for Oxygenate Blending (CBOB) tends to be the most liquid product because there are fewer areas requiring RFG in that region.

Where Does Ethanol Enter the Picture?

Ethanol is like the icing on that cake made from gasoline. (Eww. Please don’t eat it.)

The use of ethanol is largely linked to the advent of the Renewable Fuel Standard (RFS) program, which Congress enacted to reduce greenhouse gas emissions, expand the US renewable fuels sector, and diminish US reliance on imports.

Ethanol isn’t blended into gasoline blendstock at the refineries, largely because ethanol can’t be transported through pipelines. It would damage them. Strong stuff!

Instead, ethanol is most often blended in at the rack, closer to its ultimate destination. That’s why you’ll often see ethanol listed along with gasoline and diesel in rack prices.

Ethanol serves to boost octane levels in gasoline, which can be helpful. But it also raises Reid Vapor Pressure (RVP), which can be tricky.

RVP measures the volatility in gasoline and is subject to seasonal mandates. So, blending ethanol can be complicated during summer months, when people are looking for lower-RVP gasoline.

Sometimes, detergents or other additives are blended into gasoline before it hits retail stations—those additives are a way that fuel brands differentiate themselves with customers.

Happy baking!

US Midwest spot refined product market participants entered 2024 with major questions over how EPA will handle a 2022 request from a group of eight Midwest governors to allow year-round sales of E15 in their states.

The governors in 2023 asked the agency to issue regulations that would allow equal treatment of E10 and E15 during the summer of 2023 by capping the RVP for both fuels at 9 psi during the high-demand driving season.

EPA, in March 2023, proposed a rule that would allow the summertime sale of E15 in the petitioning states, but not until the spring of 2024.

Refiners, however, have argued that EPA’s decision would require them to provide a lower 7.8 lb RVP CBOB that would allow both E10 and E15 to meet the 9 psi specification.

Fuel producers, however, are concerned that because not all Midwest states signed onto the petition to EPA, the waiver could create logistical issues for the Midwest market, especially for pipelines, which could be forced to move two different CBOB RVP specifications during the summer. Some Midwest sources, however, told OPIS that if EPA grants the waiver in the spring of 2024, those states in the region that were not part of the request would likely move to the lower 7.8-lb RVP CBOB.

While the petitioning states and the ethanol industry criticized the agency for failing to approve the regulatory change in time for the 2023 driving season, the Biden administration, for a second straight summer in 2023, issued a series of waivers lifting restrictions on the sale of E15. Those did not, however, require refiners to provide lower RVP blendstock.

See also: US Ethanol Industry Explores Avenues for Expanding its Markets, Jan. 26, 2024

Midwest market participants said they would enter 2024 somewhat in the dark over what the summer RVP requirements will look like, cautioning that unrestricted sales of E15 could have big impacts on the fuel supply chain and prices.

Patrick Searles, downstream fuels policy director with the American Petroleum Institute, told the EPA at a March 2023 public hearing on the proposed rule that even with the decision to delay the move to April 2024, “there still is likely to be insufficient time to engineer projects, identify capital, obtain the permits, and contract and deploy the skilled trades to construct the systems needed.”

In September 2023, Paul Machiele, director of the EPA’s Fuel Programs Center, acknowledged that the rule could “require significant changes in the distribution systems.” And he added that EPA has the right to delay implementation if concerns over the supply persist.

And if EPA does approve the change in the spring of 2024, then many are wondering just how the decision would affect the spot gasoline market. “You instantly increase the gasoline pool by 5% with the stroke of a pen,” one source said. “What does that do to the basis?”

Spot gasoline prices trade at differentials to NYMEX futures and the question being asked by many in the market is whether more E15 will lead to lower spot RBOB prices and just how the lower 7.8 lb CBOB will be priced in relation to more typical 9 psi blendstock.

The Midwest gasoline and distillate spot market also experienced strong price volatility in 2023 and a question on the minds of many is whether this is likely to continue into the new year.

One market player, citing the unusually long period of volatility this year, said he believes more of the same is likely on tap for the Chicago market in 2024.

According to OPIS data, Chicago CBOB spot prices fell to a 2023 of just under $1.70/gal on Dec. 7, 2023. The last time the price fell below that mark was mid-February 2021.

And the 2023 low came just four months after prices hit a 2023 high above $2.80/gal.

Group 3 sub-octane gasoline also saw hefty price spikes in 2023, rising to a $3.57/gal high for the year on Sept. 7, 2023, the highest mark since late June 2022.

Similarly Group 3 ULSD hit a 2023 high price of $4.20/gal on Oct. 20, 2023, the highest recorded price in about a year.

While this type of volatility remains difficult to plan for, and market participants have grown used to price swings due to extreme weather and refinery disruptions, and one source said 2023 may be viewed by some as a reference market, given that the Midwest harvest season – a period of high distillate demand – was “ideal.”

2023 was also notable for a lack of major refinery upsets, particularly in the fourth quarter. If this trend continues into 2024, participants may have a clearer picture of what they can expect.

The Energy Information Association put Midwest refinery utilization at above 100% for two weeks starting in late August, allowing the region’s refiners to easily meet increased demand as the harvest season ramped up.

That baseline of what supply and pricing looks like when running at full capacity may provide market participants with a clearer picture for 2024 – if they can count on that continuing.

See also: Changing Regulations Could Spur Pricier Midwest Gasoline This Summer, Feb. 3, 2023

Carbon markets are increasingly being seen by countries in the Asia Pacific as a tool to reach decarbonization goals, and stay abreast of policy changes such as cross border carbon tariffs. Across the region, carbon markets fall across a full spectrum of growth – with its fair share of both emerging and mature markets.

(more…)

Anyone working in the gas liquids market knows the need (and hassle) to convert global NGLs.

NGLs — a.k.a. ethane, propane, pentanes+, normal butane and isobutane  — are shipped all over the world, every day, from export hubs as diverse as Mont Belvieu, Texas, and the Arab Gulf.

(more…)

Spot fuel markets are where gasoline, diesel, jet fuel and other commodities get a physical price tag.

(more…)

Buying fuel is confusing even for seasoned pros. We’re here to help.

The petroleum market features a slew of specialized fuel blends and no one-size-fits all requirement for what you can use — or where or when you can use it.

Whether you are new to the fuel industry or are already an expert, the words “spot,” “rack” and especially “basis” are terms that confuse even the most veteran buyer. There’s a good chance you or someone on your team may not be 100% sure what these words mean.

Why Is It Important to Understand These Fuel Pricing Basics?


Chances are you already have a fuel contract with a supplier in place. Maybe you are looking to set one up or modify one that already exists. Without a firm handle on what the difference is between futures, spot, rack and retail markets there’s a good possibility that you:

Let’s clear up some confusion with a basic guide to pricing gasoline and diesel. Much of what you will learn here also applies to jet fuel, LPG and renewables.

fuel-buying-101-snippet

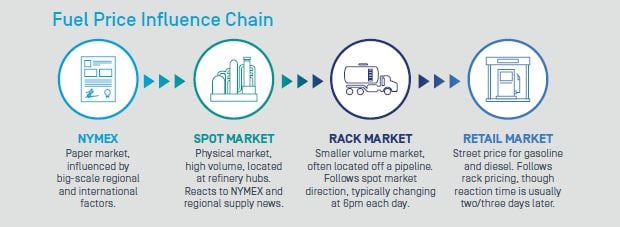
Step One: Getting to Know the Futures Market

Before you can understand spot and rack prices, you need to understand the first piece in the downstream fuel puzzle: The New York Mercantile Exchange.

The industry commonly refers to this as the NYMEX or the Merc. Sometimes it is called “the futures market” or “the print.”

It’s a mostly electronic platform exchange, on which buyers and sellers can trade various fuel commodities — on paper — any time from a month from now to 18 months in the future. That’s why it’s called a “futures” market.

They call it a “paper” market because few, if any, physical barrels ever change hands. Trade volume is made up of contracts that transact among players.

From here on out, to reduce any further confusion, we’ll refer to it as the NYMEX. The NYMEX is possibly the most influential factor in the upward/downward movement of wholesale rack markets. Oil futures affect spot markets, then rack markets, then ultimately retail markets.

The first energy contract was launched in 1978. Since then, the Merc’s launched contracts for:

These abbreviations are what you’ll see on the trading screen, so add them to your alphabet soup full of acronyms to memorize.

Thanks for the History Lesson But What’s In This for Me?

One word: Transparency.

The NYMEX really took off as a major factor in the U.S. petroleum market back in the 1980s because it was the only place refiners, suppliers, traders, jobbers, retailers and procurement end-users had full access to see the value of a commodity at any given time.

The transparency was generally not for real barrels of crude oil that you could turn into gasoline. Remember, this is mostly a paper market – physical delivery only occurs for 2% to 3% of all contracts on the current NYMEX. But, at that time, unlike today, there was no downstream price discovery.

So, the futures market became a place where fuel buyers or sellers could go to find a cost basis for fuel supply agreements. This is why, when we talk about the NYMEX, we start to introduce the concept of “basis.” More on that later…

Since the 80s, price transparency has extended to the spot market (the refinery level) and rack market (the wholesale level). We’ll dive deeper into those markets in the sections that follow. But, that clear level of transparency has always remained on the NYMEX.

In addition, the exchange is regulated by the CFTC (Commodity Futures Trading Commission), adding a level of accountability to every 1,000-barrel, or 42,000-gallon, contract traded.

The paper market is used to hedge physical fuel purchases – kind of like insurance for prices rising or falling, to protect the companies holding contracts from losses related to their physical energy business. But, for our purposes right now, the critical point is that it is the primary building block of
downstream gasoline and diesel pricing.

There are two other key elements about the futures market:

  • First, the trades are anonymous.
  • Second, and most importantly, the exchange guarantees counterparty performance. No chance of an Enron-like implosion here.

fuel-buying-101-isaacHowever, the Block Is Rarely Stable

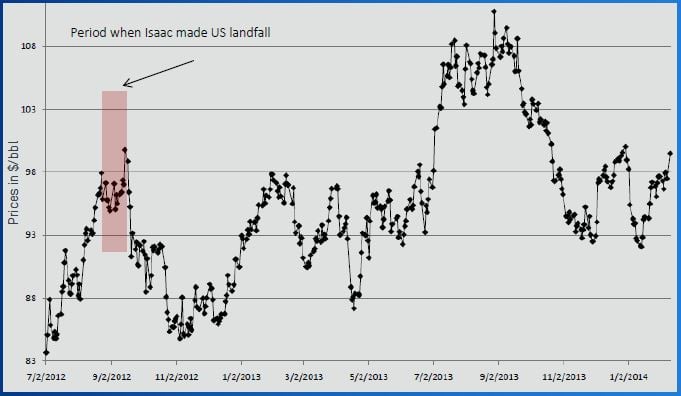
Military conflicts, hurricanes, domestic refinery problems, fluctuations in domestic output abound. Often, the first trace of any breaking news is seen on the futures screen, because oil prices spike and dive.

Take a look at this chart to see how Hurricane Isaac sent futures flying and how the market volatility continued.

The NYMEX tends to react to big-ticket items, like:

Sometimes the market “prices in” so-called fundamental factors. For example, if the U.S. government is expected to show crude stock supplies falling by a large amount, the market might slowly crawl higher in advance of the weekly inventory report as opposed to rallying sharply when expectations prove true. On the other hand, a quickly developing weather event can lead to immediate price swings.

And the market also responds to seasonal trends. For example, the RBOB market tends to peak ahead of summer driving season. The ULSD contract (a proxy for heating oil) will often spike on the first chilly fall day.

Some terminology you will hear when people talk about the market:

But, What Does This Mean in a Market That Trades ACTUAL Barrels?

The NYMEX is the first column in your price equation. If RBOB futures go higher, it will send gasoline prices up right through the fuel chain — unless the next link in the chain does something to counteract it.

Understand the fuel chain from start to finish with this helpful e-Book from OPIS.